

The BBVA Group’s earnings in the third quarter of 2013 have once again been supported by the resilience of its more recurring income, although they have also been negatively affected by quarterly fluctuations in exchange rates, the full impact of the elimination of the so-called floor clauses and the effect of the application of the different European supervisors’ recommendations on the classification of refinanced loans. The most relevant items in the different headings of the income statement are summarized below:
1. The most positive aspect of net interest income in the quarter was the reduction in the cost of funding (wholesale and retail), which has eased the pressure on customer spreads and to a great extent offset the unfavorable effect of the full impact of the elimination of the floor clauses.
2. Income from fees and commissions was in line with the figure registered the previous quarter, despite the unfavorable seasonality of the period in some geographical regions.
3. More moderate contribution from NTI compared with the first and second quarters of 2013, whose contribution was very high.
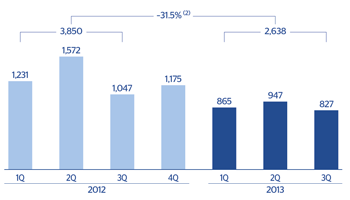
Net attributable profit (1)
(Million euros)
Consolidated income statement: quarterly evolution (1)
(Million euros)
|
|
2013 | 2012 | |||||
|---|---|---|---|---|---|---|---|
|
|
3Q | 2Q | 1Q | 4Q | 3Q | 2Q | 1Q |
| Net interest income | 3,551 | 3,679 | 3,623 | 3,910 | 3,877 | 3,741 | 3,594 |
| Net fees and commissions | 1,114 | 1,126 | 1,052 | 1,126 | 1,104 | 1,061 | 1,062 |
| Net trading income | 569 | 630 | 719 | 646 | 319 | 461 | 340 |
| Dividend income | 56 | 47 | 19 | 17 | 35 | 311 | 27 |
| Income by the equity method | 162 | 164 | 51 | 191 | 169 | 175 | 191 |
| Other operating income and expenses | (113) | (153) | 7 | (32) | 6 | 57 | 51 |
| Gross income | 5,339 | 5,493 | 5,471 | 5,858 | 5,512 | 5,806 | 5,265 |
| Operating costs | (2,777) | (2,814) | (2,758) | (2,855) | (2,771) | (2,633) | (2,528) |
| Personnel expenses | (1,452) | (1,454) | (1,458) | (1,472) | (1,447) | (1,396) | (1,347) |
| General and administrative expenses | (1,042) | (1,080) | (1,025) | (1,089) | (1,064) | (1,001) | (951) |
| Depreciation and amortization | (283) | (279) | (276) | (294) | (259) | (236) | (230) |
| Operating income | 2,562 | 2,679 | 2,712 | 3,003 | 2,741 | 3,173 | 2,738 |
| Impairment on financial assets (net) | (1,854) | (1,336) | (1,376) | (2,675) | (2,038) | (2,182) | (1,085) |
| Provisions (net) | (137) | (130) | (167) | (228) | (195) | (98) | (130) |
| Other gains (losses) | (198) | (172) | 343 | (269) | (561) | (311) | (223) |
| Income before tax | 373 | 1,040 | 1,513 | (168) | (53) | 582 | 1,299 |
| Income tax | (13) | (261) | (395) | 220 | 275 | 3 | (223) |
| Net income from on-going operations | 360 | 779 | 1,118 | 52 | 222 | 584 | 1,076 |
| Net income from discontinued operations | 7 | 570 | 823 | 138 | 83 | 75 | 96 |
| Net income | 368 | 1,349 | 1,941 | 190 | 305 | 659 | 1,173 |
| Non-controlling interests | (172) | (202) | (206) | (170) | (159) | (154) | (168) |
| Net attributable profit | 195 | 1,147 | 1,734 | 20 | 146 | 505 | 1,005 |
| Adjusted (2) | (631) | 200 | 870 | (1,155) | (901) | (1,067) | (226) |
| Net attributable profit (adjusted) (2) | 827 | 947 | 865 | 1,175 | 1,047 | 1,572 | 1,231 |
| Basic earnings per share (euros) | 0.03 | 0.20 | 0.31 | 0.01 | 0.03 | 0.09 | 0.19 |
| Basic earnings per share diluted (euros) (3) | 0.03 | 0.20 | 0.31 | 0.01 | 0.03 | 0.09 | 0.20 |
| Adjusted earnings per share diluted (euros) (2-3) | 0.14 | 0.16 | 0.15 | 0.21 | 0.19 | 0.29 | 0.23 |
Consolidated income statement: quarterly evolution (1)
(Million euros)
|
|
January-Sep. 13 | ∆% | Δ % at constant exchange rates | January-Sep. 12 |
|---|---|---|---|---|
| Net interest income | 10,853 | (3.2) | 1.4 | 11,212 |
| Net fees and commissions | 3,292 | 2.0 | 5.4 | 3,228 |
| Net trading income | 1,918 | 71.2 | 78.9 | 1,121 |
| Dividend income | 122 | (67.3) | (67.2) | 373 |
| Income by the equity method | 376 | (29.8) | (29.6) | 536 |
| Other operating income and expenses | (259) | n.m. | n.m. | 113 |
| Gross income | 16,303 | (1.7) | 1.9 | 16,583 |
| Operating costs | (8,349) | 5.3 | 8.7 | (7,931) |
| Personnel expenses | (4,364) | 4.2 | 7.4 | (4,190) |
| General and administrative expenses | (3,147) | 4.3 | 8.0 | (3,016) |
| Depreciation and amortization | (838) | 15.6 | 19.9 | (725) |
| Operating income | 7,954 | (8.1) | (4.3) | 8,652 |
| Impairment on financial assets (net) | (4,566) | (13.9) | (13.2) | (5,305) |
| Provisions (net) | (434) | 2.6 | 12.7 | (423) |
| Other gains (losses) | (28) | (97.5) | (97.5) | (1,096) |
| Income before tax | 2,926 | 60.1 | 85.8 | 1,827 |
| Income tax | (669) | n.m. | n.m. | 55 |
| Net income from on-going operations | 2,257 | 19.9 | 34.4 | 1,883 |
| Net income from discontinued operations | 1,400 | n.m. | n.m. | 254 |
| Net income | 3,657 | 71.1 | 89.6 | 2,137 |
| Non-controlling interests | (581) | 20.7 | 43.3 | (481) |
| Net attributable profit | 3,077 | 85.8 | 101.9 | 1,656 |
| Adjusted (2) | 438 | n.m. | n.m. | (2,194) |
| Net attributable profit (adjusted) (2) | 2,638 | (31.5) | (29.0) | 3,850 |
| Basic earnings per share (euros) | 0.55 |
|
|
0.30 |
| Basic earnings per share diluted (euros) (3) | 0.54 |
|
|
0.30 |
| Adjusted earnings per share diluted (euros) (2-3) | 0.47 |
|
|
0.69 |
4. Less negative impact of the adjustment for hyperinflation in Venezuela, which explains the improvement in the other operating income and expenses heading over the last three months.
5. Expenses slightly below the figure registered from April to June 2013. The cost control policy applied in developed countries has partially offset the increase in emerging economies.
6. Higher provisions than in the first and second quarters of 2013, due to the aforementioned application of the European regulators’ recommendations on the classification of refinanced loans.