

7. Risk management
Financial institutions that deal in financial instruments must assume or transfer one or more types of risk in their transactions. The main risks associated with financial instruments are:
- Credit risk: This arises from the probability that one party to a financial instrument will fail to meet its contractual obligations for reasons of insolvency or inability to pay and cause a financial loss for the other party.
-
Market risk: This is originated by the likelihood of losses in the value of the positions held as a result of changes in the market prices of financial instruments. It includes three types of risks:
- Interest-rate risk: This arises from variations in market interest rates.
- Currency risk: This is the risk resulting from variations in foreign-currency exchange rates.
- Price risk: This is the risk resulting from variations in market prices, either due to factors specific to the instrument itself, or alternatively to factors which affect all the instruments traded on a specific market.
- Liquidity risk: This arises from the possibility that a company cannot meet its payment commitments, or to do so must resort to borrowing funds under onerous conditions, or risking its image and the reputation of the entity.
Principles and policies -
The aim of the Global Risk Management (GRM) function is to preserve the BBVA Group's solvency, help define its strategy with respect to risk and assume and facilitate the development of its businesses. Its activity is governed by the following principles:
- The risk management function is single, independent and global.
- The risks assumed by the Group must be compatible with the capital adequacy target and must be identified, measured and assessed. Risk monitoring and management procedures and sound mechanisms of control and mitigation systems must likewise be in place.
- All risks must be managed integrally during their life cycle, and be treated differently depending on their nature and with active portfolio management based on a common measure (economic capital).
- It is each business area’s responsibility to propose and maintain its own risk profile, within its autonomy in the corporate action framework (defined as the set of risk control policies and procedures defined by the Group), using an appropriate risk infrastructure to control their risks.
- The infrastructures created for risk control must be equipped with means (in terms of people, tools, databases, information systems and procedures) that are sufficient for their purpose, so that there is a clear definition of roles and responsibilities, thus ensuring efficient assignment of resources among the corporate area and the risk units in business areas.
In the light of these principles, the BBVA Group has developed an integrated risk management system that is structured around three main components: a corporate risk governance scheme (with suitable segregation of duties and responsibilities); a set of tools, circuits and procedures that constitute the various risk management regimes; and an internal control system that is appropriate to the nature and size of the risks assumed.
Corporate governance system -
The BBVA Group has developed a system of corporate governance that is in line with the best international practices and adapted it to the requirements of the regulators in the country in which its different units operate.
With respect to the risks assumed by the Group, the Board of Directors of the Bank is responsible for establishing the general principles that define the risk objectives profile of the entities, approving the management policies for control and management of these risks and ensuring regular monitoring of the internal systems of risk information and control. The Board is supported in this function by the Standing Committee and the Risk Committee. The main mission of the latter is to assist the Board in carrying out its functions associated with risk control and management.
Acording to Article 36 of the Board Regulations, the Risk Committee is assigned the following duties for these purposes:
- To analyze and evaluate proposals related to the Group’s risk management and oversight policies and strategies.
- To monitor the extent to which the risks actually assumed match the established risk profiles.
- To assess and approve, where applicable, any transactions whose size could compromise the Group’s capital adequacy or recurrent earnings, or that present significant potential operational or reputational risks.
- To ensure that the Group possesses the means, systems, structures and resources in accordance with best practices to develop its risk management strategy.
The risk management and control function is distributed among the risk units within the business areas and the Corporate Risk Area, which defines global policy and strategies. The risk units in the business areas propose and manage the risk profiles within their area of autonomy, though they always respect the corporate framework for action.
The Corporate Risk Area combines a vision by risk type with a global vision. It is divided into five units, as follows:
- Corporate Risk Management: Responsible for the management and control of credit, market, technical, structural, real estate and non-banking risks.
- Validation & Control: Manages the internal control and operational risk systems, the internal validation of the measurement models and the acceptance of new risks.
- Technology & Methodologies: Responsible for the management of the technological and methodological developments required for risk management in the Group.
- Technical Secretariat: Undertakes technical tests of the proposals made to the Risk Management Committee and the Risk Committee; prepares and promotes the regulations applicable to social and environmental risk management.
This structure gives the Corporate Risk Area reasonable security with respect to:
- integration, control and management of all the Group’s risks;
- the application throughout the Group of standard principles, policies and metrics; and
- the necessary knowledge of each geographical area and each business.
This organizational scheme is complemented by various committees, which include the following:
- The Global Internal Control and Operational Risk Committee: Its task is to undertake a review at both Group and business unit level of the control environment and the effectiveness of the operational risk internal control and management systems; as well as to monitor and analyze the main operational risks the Group is subject to, including those that are cross-cutting in nature. This committee is therefore the highest operational risk management body in the Group.
- The Global Risk Management Committee: This committee is made up of the risk managers from the risk units located in the business areas and the managers of the Corporate Risk Area units. Among its responsibilities are the following: establishing the Group's risk strategy (especially as regards policies and structure of this function in the Group), presenting its proposal to the appropriate governing bodies for their approval, monitoring the management and control of risks in the Group and adopting any actions necessary.
- The GRM Management Committee: Made up of the corporate directors of the Group's risk unit and those responsible for risks in the different countries and business areas. It reviews the Group’s risk strategy and the general implementation of the main risk projects and initiatives in the business areas.
- The Risk Management Committee: Its permanent members are the Global Risk Management director, the Corporate Risk Management director and the Technical Secretariat. The other committee members propose the operations that are analyzed in its working sessions. The committee analyzes and, if appropriate, authorizes, financial programs and operations within its scope and submits the proposals whose amounts exceed the set limits to the Risks Committee, when its opinion on them is favorable.
- The Assets and Liabilities Committee (ALCO): The committee is responsible for actively managing structural interest rate and foreign exchange risk positions, global liquidity and the Group’s capital resources.
- The Technology and Methodologies Committee: The committee decides on the effectiveness of the models and infrastructures developed to manage and control risks that are integrated in the business areas, within the framework of the operational model of Global Risk Management.
- The New Products Committee: The committee’s functions are to assess and, if appropriate, to approve the characteristics of new products before they are put on the market; to undertake subsequent control and monitoring for newly authorized products; and to foster business in an orderly way to enable it to develop in a controlled environment.
Tools, circuits and procedures -
The BBVA Group has an established integrated risk management system that meets the needs derived from different types of risk to which it is subject. It is set out in a number of manuals. These manuals provide the measuring tools for the acceptance, assessment and monitoring of risks, define the circuits and procedures applicable to operations by entities and the criteria for their management.
The BBVA Group’s main activities with respect to the management and control of its risks are as follows:
- Calculation of exposure to risks of the different portfolios, taking into account any possible mitigating factors (guarantees, balance netting, collaterals, etc.).
- Calculation of the probabilities of default (hereinafter, “PD”).
- Estimation of the foreseeable losses in each portfolio, assigning a PD to new operations (rating and scoring).
- Measurement of the risk values of the portfolios in different scenarios through historical simulations.
- Establishment of limits to potential losses according to the different risks incurred.
- Determination of the possible impacts of structural risks on the Group’s consolidated income statement.
- Determination of limits and alerts to guarantee the Group’s liquidity.
- Identification and quantification of operational risks by business lines to make their mitigation easier through the appropriate corrective actions.
- Definition of the effective circuits and procedures to achieve established objectives, etc.
Internal control system -
The BBVA Group’s internal control system is based on the best practices developed in “Enterprise Risk Management – Integrated Framework” by the Committee of Sponsoring Organizations of the Treadway Commission(COSO) as well as in “Framework for Internal Control Systems in Banking Organizations” by the Bank for International Settlements (BIS).
The Group's system for internal control is therefore part of the Integral Risk Management Framework. This is the system within the Group that involves its Board of Directors, management and its entire staff. It is designed to identify and manage risks facing the Group entities in such a way as to ensure that the business targets established by the Group’s management are met. The Integrated Risk Management Framework is made up of specialized units (Risks, Compliance, Global Accounting and Management Information, and Legal Services), and the Internal Control, Operational Risk and Internal Audit functions.
Among the principles underpinning the Internal Control system are the following:
- Its core element is the “process.”
- The form in which the risks are identified, assessed and mitigated must be unique for each process; and the systems, tools and information flows that support the internal control and operational risk activities must be unique, or at least be administered fully by a single unit.
- The responsibility for internal control lies with the Group’s business units, and at a lower level, with each of the entities that make them up. Each business unit’s Internal Control and Operational Risk Management is responsible for implementing the system of control within its scope of responsibility and managing the existing risk by proposing any improvements to processes it considers appropriate.
- Given that some business units have a global scope of responsibility, there are cross-cutting control functions which supplement the control mechanisms mentioned earlier.
- The Internal Control and Operational Risk Committee in each business unit is responsible for approving suitable mitigation plans for each existing risk or weakness. This committee structure culminates at the Group’s Global Internal Control and Operational Risk Committee.
- The specialized units promote policies and draw up internal regulations. It is the responsibility of the Corporate Risk Area to develop them further and apply them.
Risk concentrations -
In the trading area, limits are approved each year by the Board of Directors’ Risk Committee on exposures to trading, structural interest rate, structural exchange rate, equity and liquidity; this applies both to the banking entities and to the asset management, pension and insurance businesses. These limits factor in many variables, including economic capital and earnings volatility criteria, and are reinforced with alert triggers and a stop-loss scheme.
In relation to credit risk, maximum exposure limits are set by customer and country; generic limits are also set for maximum exposure to specific operations or products. Limits are allocated based on iso-risk curves, determined as the sum of maximum foreseeable losses and economic capital, and its ratings-based equivalence in terms of gross nominal exposure.
There is a threshold in terms of a maximum risk concentration level of 10% of Group equity: up to this level the authorization of new risks requires in-depth knowledge of the client, and the markets and sectors in which it operates.
For retail portfolios, potential concentrations of risk in geographical areas or certain risk profiles are analyzed in relation to overall risk and earnings volatility; where appropriate, the mitigating measures considered most appropriate are established.
7.1 Credit risk
7.1.1 Maximum credit risk exposure
The BBVA Group’s maximum credit risk exposure by headings in the balance sheet as of December 31, 2011, 2010 and 2009, is given below. It does not recognize the availability of collateral or other credit enhancements to guarantee compliance with payment obligations. The details are broken down by financial instrument and counterparties.
In the case of financial assets recognized in the consolidated balance sheets, exposure to credit risk is considered equal to its gross accounting value, not including valuation adjustments (impairment losses, uncollected interest payments, derivatives and others), with the sole exception of trading and hedging derivatives.
The maximum exposure to credit risk on financial guarantees granted is the maximum that the Group would be liable for if these guarantees were called in, and that is their carrying amount.
The information on trading and hedging derivatives set out in the next table is a better reflection of the maximum credit risk exposure than the amounts shown on the consolidated balance sheet because it does not only include the market value on the date of the transactions (the carrying amount only shows this figure); it also estimates the potential risk of these transactions on their due date.
However, credit risk originating from the derivatives in which the Group operates is mitigated through the contractual rights existing for offsetting accounts at the time of their settlement. This has reduced the Group's exposure to credit risk to €37,817 million as of December 31, 2011 (€27,933 million and €27,026 million as of December 31, 2010 and 2009, respectively).
| Maximum Credit Risk Exposure | Notes | Millions of Euros | ||
|---|---|---|---|---|
| 2011 | 2010 | 2009 | ||
| Financial assets held for trading |
|
20,975 | 24,358 | 34,672 |
| Debt securities | 10 | 20,975 | 24,358 | 34,672 |
| Government |
|
17,989 | 20,397 | 31,290 |
| Credit institutions |
|
1,882 | 2,274 | 1,384 |
| Other sectors |
|
1,104 | 1,687 | 1,998 |
| Other financial assets designated at fair value through profit or loss |
|
708 | 691 | 639 |
| Debt securities | 11 | 708 | 691 | 639 |
| Government |
|
129 | 70 | 60 |
| Credit institutions |
|
44 | 87 | 83 |
| Other sectors |
|
535 | 535 | 496 |
| Available-for-sale financial assets |
|
52,008 | 50,602 | 57,067 |
| Debt securities | 12 | 52,008 | 50,602 | 57,067 |
| Government |
|
35,801 | 33,074 | 38,345 |
| Credit institutions |
|
7,137 | 11,235 | 12,646 |
| Other sectors |
|
9,070 | 6,293 | 6,076 |
| Loans and receivables |
|
388,949 | 373,037 | 353,741 |
| Loans and advances to credit institutions | 13.1 | 26,013 | 23,604 | 22,200 |
| Loans and advances to customers | 13.2 | 359,855 | 347,210 | 331,087 |
| Government |
|
35,090 | 31,224 | 26,219 |
| Agriculture |
|
4,841 | 3,977 | 3,924 |
| Industry |
|
37,217 | 36,578 | 42,799 |
| Real estate and construction |
|
50,989 | 55,854 | 55,766 |
| Trade and finance |
|
55,748 | 53,830 | 48,936 |
| Loans to individuals |
|
139,063 | 135,868 | 126,488 |
| Other |
|
36,907 | 29,879 | 26,955 |
| Debt securities | 13.3 | 3,081 | 2,223 | 454 |
| Government |
|
2,128 | 2,040 | 342 |
| Credit institutions |
|
631 | 6 | 4 |
| Other sectors |
|
322 | 177 | 108 |
| Held-to-maturity investments | 14 | 10,955 | 9,946 | 5,438 |
| Government |
|
9,896 | 8,792 | 4,064 |
| Credit institutions |
|
451 | 552 | 754 |
| Other sectors |
|
608 | 602 | 620 |
| Derivatives (trading and hedging) |
|
58,683 | 44,762 | 42,836 |
| Subtotal |
|
532,278 | 503,396 | 494,393 |
| Valuation adjustments |
|
594 | 299 | 436 |
| Total Financial Assets Risk |
|
532,872 | 503,695 | 494,829 |
| Financial guarantees |
|
39,904 | 36,441 | 33,185 |
| Drawable by third parties |
|
88,978 | 86,790 | 84,925 |
| Government |
|
3,143 | 4,135 | 4,567 |
| Credit institutions |
|
2,417 | 2,303 | 2,257 |
| Other sectors |
|
83,419 | 80,352 | 78,101 |
| Other contingent risks |
|
4,787 | 3,784 | 7,398 |
| Total Contingent Risks and Commitments | 34 | 133,670 | 127,015 | 125,508 |
| Total Maximum Credit Exposure |
|
666,542 | 630,710 | 620,337 |
The amount of financial assets that would be irregular if their conditions had not been renegotiated is not significant with respect to the BBVA Group's total loans and receivables as of December 31, 2011.
7.1.2 Mitigation of credit risk, collateralized credit risk and other credit enhancements
In most cases, maximum exposure to credit risk is reduced by collateral, credit enhancements and other actions which mitigate the Group’s exposure. The BBVA Group applies a credit risk hedging and mitigation policy deriving from a banking approach focused on relationship banking. The existence of guarantees could be a necessary but not sufficient instrument for accepting risks, as the assumption of risks by the Group requires the prior verification of the debtor's capacity for repayment, or that the debtor can generate sufficient resources to allow the amortization of the risk incurred under the agreed terms.
The policy of accepting risks is therefore organized into three different levels in the BBVA Group:
- Analysis of the financial risk of the operation, based on the debtor’s capacity for repayment or generation of funds;
- The constitution of guarantees that are adequate, or at any rate generally accepted, for the risk assumed; monetary, secured, personal or hedge guarantees; and finally,
- Assessment of the repayment risk (asset liquidity) of the guarantees received.
The procedures for the management and valuation of collaterals are set out in the Internal Manuals on Credit Risk Management Policies (retail and wholesale), which establish the basic principles for credit risk management, including the management of collateral assigned in transactions with customers.
The methods used to value the collateral are in line with the best market practices and imply the use of appraisal of real-estate collateral, the market price in market securities, the trading price of shares in mutual funds, etc. All collaterals assigned must be properly drawn up and entered in the corresponding register. They must also have the approval of the Group's legal units.
The following is a description of the main types of collateral for each financial instrument class:
- Financial instruments held for trading: The guarantees or credit enhancements obtained directly from the issuer or counterparty are implicit in the clauses of the instrument.
- Trading and hedging derivatives: In derivatives, credit risk is minimized through contractual netting agreements, where positive- and negative-value derivatives with the same counterparty are offset for their net balance. There may likewise be other kinds of guarantees, depending on counterparty solvency and the nature of the transaction.
The BBVA Group has a broad range of credit derivatives. These contracts allow it to buy or sell protection against a share or index. The Group uses credit derivatives to mitigate credit risk in its loan book and other cash positions and to cover risks assumed in market transactions with other clients and counterparties.
Credit derivatives may follow different payment and netting agreements, under the rules of the International Swaps and Derivatives Association (ISDA). The triggers to the agreement include the bankruptcy of the credit institution in question, swiftly accumulating indebtedness, default, restructuring or the winding up of the entity.
- Other financial assets and liabilities designated at fair value through profit or loss and Available-for-sale financial assets: The guarantees or credit enhancements obtained directly from the issuer or counterparty are inherent to the structure of the instrument.
-
Loans and receivables:
- Loans and advances to credit institutions: These usually only have the counterparty’s personal guarantee.
- Loans and advances to customers: Most of these operations are backed by personal guarantees extended by the counterparty. There may also be collateral to secure loans and advances to customers (such as mortgages, cash guarantees, pledged securities and other collateral), or to obtain other credit enhancements (bonds, hedging, etc.).
- Debt securities: Guarantees or credit enhancements obtained directly from the issuer or counterparty are inherent to the structure of the instrument.
- Held-to-maturity investments: Guarantees or credit enhancements obtained directly from the issuer or counterparty are inherent to the structure of the instrument.
- Financial guarantees, other contingent risks and drawable by third parties: These have the counterparty’s personal guarantee.
The Group’s collateralized credit risk as of December 31, 2011, 2010 and 2009, excluding balances deemed impaired, is broken down in the table below:
| Collateralized Credit Risk | Millions of Euros | ||
|---|---|---|---|
| 2011 | 2010 | 2009 | |
| Mortgage loans | 130,703 | 132,628 | 127,957 |
| Operating assets mortgage loans | 3,732 | 3,638 | 4,050 |
| Home mortgages | 109,199 | 108,224 | 99,493 |
| Non-home mortgages | 17,772 | 20,766 | 24,414 |
| Secured loans, except mortgage | 29,353 | 18,154 | 20,917 |
| Cash guarantees | 332 | 281 | 231 |
| Secured loan (pledged securities) | 590 | 563 | 692 |
| Rest of secured loans | 28,431 | 17,310 | 19,994 |
| Total | 160,056 | 150,782 | 148,874 |
As of December 31, 2011, in relation to mortgages, the average weighted amount pending loan amortization was 52% of the collateral pledged (53% as of December 31, 2010 and 54% as of December 31, 2009).
7.1.3 Credit quality of financial assets that are neither past due nor impaired
The BBVA Group has tools (“scoring” and “rating”) that enable it to rank the credit quality of its operations and customers based on an assessment and its correspondence with the probability of default (“PD”) scales. To analyze the performance of PD, the Group has a series of tracking tools and historical databases that collect the pertinent information generated internally, which can basically be grouped together in scoring and rating models.
- Scoring
Scoring is a decision-making model that contributes to both the arrangement and management of retail loans: consumer loans, mortgages, credit cards for individuals, etc. Scoring is the tool used to decide to whom a loan should be assigned, what amount should be assigned and what strategies can help establish the price, because it is an algorithm that sorts transactions by their credit quality. This algorithm enables the BBVA Group to assign a score to each transaction requested by a customer, on the basis of a series of objective characteristics that have statistically been shown to discriminate between the quality and risk of this type of transactions. The advantage of scoring lies in its simplicity and homogeneity: all that is needed is a series of objective data for each customer, and this data is analyzed automatically using an algorithm.
There are three types of scoring, based on the information used and on its purpose:
- Reactive scoring: measures the risk of a transaction requested by an individual using variables relating to the requested transaction and to the customer’s socio-economic data available at the time of the request. The new transaction is approved or rejected depending on the score given.
- Behavioral scoring: scores transactions for a given product in an outstanding risk portfolio of the entity, enabling the credit rating to be tracked and the customer’s needs to be anticipated. It uses transaction and customer variables available internally. Specifically, variables that refer to the behavior of both the product and the customer.
- Proactive scoring: gives a score at customer level using variables related to the individual’s general behavior with the entity, and to his/her payment behavior in all the contracted products. The purpose is to track the customer’s credit quality and it is used to pre-grant new transactions.
- Rating
Rating tools, as opposed to scoring tools, do not assess transactions but focus on the rating of customers instead: companies, corporations, SMEs, public authorities, etc. A rating tool is an instrument that, based on a detailed financial study, helps determine a customer’s ability to meet his/her financial obligations. The final rating is usually a combination of various factors: on the one hand, quantitative factors, and on the other hand, qualitative factors. It is a middle road between an individual analysis and a statistical analysis.
The main difference between ratings and scorings is that the latter are used to assess retail products, while ratings use a wholesale banking customer approach. Moreover, scorings only include objective variables, while ratings add qualitative information. And although both are based on statistical studies, adding a business view, rating tools give more weight to the business criterion compared to scoring tools.
For portfolios where the number of defaults is very low (sovereign risk, corporates, financial entities, etc.) the internal information is supplemented by “benchmarking” of the external rating agencies (Moody's, Standard & Poor’s and Fitch). To this end, each year the PDs compiled by the rating agencies at each level of risk rating are compared, and the measurements compiled by the various agencies are mapped against those of the BBVA master rating scale.
Once the default probability of a transaction or customer has been calculated, a "business cycle adjustment" is carried out. This is a means of establishing a measure of risk that goes beyond the time of its calculation. The aim is to capture representative information of the behavior of portfolios over a complete economic cycle. This probability is linked to the Master Rating Scale prepared by the BBVA Group to enable uniform classification of the Group’s various asset risk portfolios.
The table below shows the abridged scale used to classify the BBVA Group’s outstanding risk as of December 31, 2011:
| Internal rating Reduced List (17 groups) |
Probability of default (basic points) |
||
|---|---|---|---|
| Average | Minimum from >= | Maximum | |
| AAA | 1 | - | 2 |
| AA+ | 2 | 2 | 3 |
| AA | 3 | 3 | 4 |
| AA- | 4 | 4 | 5 |
| A+ | 5 | 5 | 6 |
| A | 8 | 6 | 9 |
| A- | 10 | 9 | 11 |
| BBB+ | 14 | 11 | 17 |
| BBB | 20 | 17 | 24 |
| BBB- | 31 | 24 | 39 |
| BB+ | 51 | 39 | 67 |
| BB | 88 | 67 | 116 |
| BB- | 150 | 116 | 194 |
| B+ | 255 | 194 | 335 |
| B | 441 | 335 | 581 |
| B- | 785 | 581 | 1,061 |
| C | 2,122 | 1,061 | 4,243 |
The table below outlines the distribution of exposure, including derivatives, by internal ratings, to corporates, financial entities and institutions (excluding sovereign risk), of the BBVA Group’s main entities as of December 31, 2011:
| Credit Risk Distribution by Internal Rating | 2011 | |
|---|---|---|
| Amount (Millions of Euros) |
% | |
| AAA/AA+/AA/AA- | 47,047 | 18.42% |
| A+/A/A- | 94,192 | 36.88% |
| BBB+ | 23,685 | 9.27% |
| BBB | 10,328 | 4.04% |
| BBB- | 10,128 | 3.97% |
| BB+ | 12,595 | 4.93% |
| BB | 11,361 | 4.45% |
| BB- | 14,695 | 5.75% |
| B+ | 10,554 | 4.13% |
| B | 11,126 | 4.36% |
| B- | 6,437 | 2.52% |
| CCC/CC | 3,266 | 1.28% |
| Total | 255,414 | 100.00% |
From all the possible range of transactions/customers with a credit rating, and therefore with a probability of default, homogeneous probability levels are established to classify the portfolio. The concentration of levels will be higher when more discrimination is needed and lower when discrimination is not so important. These levels represent the ratings needed to ensure proper classification of the portfolio.
These different values and their probability of default (PD) limits have been determined using as a reference the rating scales and default rates applied by the external agencies Standard & Poor’s and Moody’s. Thus, the PD levels for the BBVA Group’s Master Rating Scale are established. Although this scale is common to the entire Group, the calibrations (mapping scores to PD sections/Master Rating Scale levels) are carried out at tool level for each country in which the Group has tools available.
7.1.4 Policies for preventing excessive risk concentration
In order to prevent the build-up of excessive concentrations of credit risk at the individual, country and sector levels, the BBVA Group maintains maximum permitted risk concentration indices updated at individual and portfolio sector levels tied to the various observable variables within the field of credit risk management. The limit on the Group’s exposure or financial commitment to a specific customer therefore depends on the customer’s credit rating, the nature of the risks involved, and the Group’s presence in a given market, based on the following guidelines:
- The aim is, as far as possible, to combine the customer's credit needs (commercial/financial, short-term/long-term, etc.) with the interests of the Group.
- Any legal limits that may exist concerning risk concentration are taken into account (relationship between risks with a customer and the capital of the entity that assumes them), the markets, the macroeconomic situation, etc.
- To undertake a proper management of risk concentration, and if necessary generate actions on such risks, a number of different levels of monitoring have been established according to the amount of global risks maintained with the same customer. Any risk concentrations with the same customer or group may generate losses of more than €18 million are authorized and monitored by the Risk Committee of the Bank's Board of Directors. In terms of exposure, this amount is equivalent to 10% of the BBVA Group's eligible capital for a customer with an AAA credit rating and 1% for a customer with a BB credit rating.
7.1.5 Sovereign risk exposure
Sovereign risk management
The risk associated with the transactions involving sovereign risk is identified, measured, controlled and tracked by a centralized unit integrated in the BBVA Group’s Risk Area. Its basic functions involve the preparation of individual reports on the countries where sovereign risk exists (called “financial programs”), their tracking, the assignment of ratings associated with the analyzed countries and, in general, supporting the Group in terms of any request for information related to this type of operations. The risk policies established in the financial programs are approved by the relevant risk committees based on the delegation system established for decision-making by the Bank’s senior management.
The country risk area also tracks the countries on an ongoing basis in order to adapt its risk and mitigation policies to any macroeconomic and political changes that may occur. Moreover, it regularly updates its internal ratings and forecasts for the countries. The internal rating assignment methodology is based on the assessment of quantitative and qualitative parameters which are in line with those used by other significant entities, such as multilateral organizations (IMF, WB), rating agencies or export credit companies.
Below is a breakdown, as of December 31, 2011, of the exposure of the financial instruments registered in the accompanying consolidated balance sheets by the type of counterparty in each country and according to the residence of the counterparty. It does not take into account valuation adjustments, impairment losses or loan-loss provisions:
| Risk Exposure by Countries | Millions of euros | ||||
|---|---|---|---|---|---|
| 2011 | |||||
| Sovereign Risk (*) |
Financial Institutions | Other Sectors | Total | % | |
| Spain | 56,473 | 6,883 | 178,068 | 241,424 | 51.1% |
| Turkey | 3,414 | 220 | 8,822 | 12,456 | 2.6% |
| United Kigdom | 120 | 7,381 | 3,566 | 11,067 | 2.3% |
| Italy | 4,301 | 492 | 4,704 | 9,497 | 2.0% |
| Portugal | 279 | 829 | 6,715 | 7,824 | 1.7% |
| France | 619 | 1,903 | 3,038 | 5,561 | 1.2% |
| Germany | 592 | 1,048 | 911 | 2,551 | 0.5% |
| Ireland | 7 | 183 | 212 | 401 | 0.1% |
| Greece | 109 | 5 | 32 | 146 | 0.0% |
| Rest of Europe | 739 | 4,419 | 6,072 | 11,230 | 2.4% |
| Europe | 66,654 | 23,363 | 212,141 | 302,157 | 63.9% |
| Mexico | 22,875 | 5,508 | 31,110 | 59,493 | 12.6% |
| The United States | 3,501 | 3,485 | 42,589 | 49,576 | 10.5% |
| Rest of countries | 7,281 | 3,803 | 50,563 | 61,647 | 13.0% |
| Total Rest of countries | 33,657 | 12,796 | 124,262 | 170,716 | 36.1% |
| Total Exposure to Financial Instruments | 100,311 | 36,159 | 336,403 | 472,873 | 100.0% |
The exposure to sovereign risks shown in the above table is basically due to the positions held in government debt securities in countries in which the Group operates. They are used for the management by ALCO of the interest-rate risk on the balance sheet of the Group’s entities in these countries, as well as for hedging by insurance companies within the BBVA Group of pension and insurance commitments.
Sovereign risk exposure in Europe
The European sovereign debt crisis deepened in 2011. Contagion of the financial tension during the year increased: first, to countries on the European periphery that were not subject to bailout programs, such as Italy and Spain; then, as doubts increased about the capacity of governments in the euro zone to resolve the crisis, even some core countries in Europe with sound finances were affected by this tension.
As for the sovereign risk of European countries, despite the agreements reached at the European summit held at the end of July, sovereign debt markets, including those in Spain, and especially Italy, continue to be subject to intense pressure.
On December 8, 2011, figures were published on the exposure of the BBVA Group’s credit institutions to European sovereign risk as of September 30, 2011. The publication was part of the exercise carried out by the European Banking Authority (EBA) (see Note 33) to assess the minimum capital levels of European banking groups, as defined in the European Union's Capital Requirement Directive (CRD). As of December 31, 2011, the breakdown by types of financial instruments of the total exposure faced by the Group’s credit institutions to sovereign risks in European countries, disregarding any valuation adjustments, impairment losses or loan-loss provisions, has been as follows:
| Exposure to Sovereign Risk by European Union Countries | Millions of euros | |||||||
|---|---|---|---|---|---|---|---|---|
| 2011 | ||||||||
| Debt securities | Loans and Receivables | Derivatives | Total | % | ||||
| Financial Assets Held-for-Trading | Available-for-Sale Financial Assets | Held-to-Maturity Investments | Direct Exposure | Indirect Exposure | ||||
| Spain | 4,366 | 15,225 | 6,520 | 26,637 | 96 | - | 52,844 | 89.1% |
| Italy | 350 | 634 | 2,956 | 184 | - | (23) | 4,101 | 6.9% |
| France | 338 | 12 | 254 | - | - | (3) | 601 | 1.0% |
| Germany | 513 | 6 | 69 | - | (3) | (2) | 583 | 1.0% |
| Portugal | 39 | 11 | 13 | 216 | - | (1) | 278 | 0.5% |
| United Kingdom | - | 120 | - | - | (3) | - | 117 | 0.2% |
| Greece | - | 10 | 84 | 15 | - | (8) | 101 | 0.2% |
| Hungary | - | 53 | - | - | - | - | 53 | 0.1% |
| Ireland | - | 7 | - | - | - | 1 | 8 | 0.0% |
| Rest of Europe | 155 | 351 | - | 130 | - | 2 | 638 | 1.1% |
| Total Exposure to Sovereign Counterparties (European Union) | 5,761 | 16,429 | 9,896 | 27,182 | 89 | (34) | 59,323 | 100.0% |
In the above table, derivatives, which include Credit Derivative Swaps (CDS), are reflected at their fair value as of December 31, 2011. The breakdown of the notional value of the CDS in which the Group’s credit institutions act as sellers or buyers of protection against sovereign risks in European countries is as follows:
| Exposure to Sovereign Risk by European Countries | Millions of euros | |||
|---|---|---|---|---|
| 2011 | ||||
| Credit derivates (CDS) and other contracts in which the Group act as a protection seller | Credit derivates (CDS) and other contracts in which the Group act as a protection buyer | |||
| Notional Value | Fair Value | Notional Value | Fair Value | |
| Spain | 20 | 2 | 20 | (2) |
| Italy | 283 | 38 | 465 | (61) |
| Germany | 182 | 4 | 184 | (6) |
| France | 102 | 3 | 123 | (6) |
| Portugal | 85 | 21 | 93 | (22) |
| United Kingdom | 20 | 2 | 20 | (2) |
| Grece | 53 | 25 | 66 | (33) |
| Hungary | - | - | 2 | (0) |
| Ireland | 82 | 10 | 82 | (9) |
| Rest of Europe | 294 | 31 | 329 | (29) |
| Total exposure to Sovereign Counterparties | 1,119 | 136 | 1,382 | (170) |
The main counterparties of these CDS are credit institutions with a high credit quality. The CDS contracts are market standards with the normal clauses defining events that trigger payment.
As can be seen in the above tables, exposure to sovereign risk in Europe is concentrated in Spain and Italy. As of December 31, 2011, the breakdown of total exposure faced by the Group’s credit institutions to these countries, by maturity of the financial instruments, is as follows:
| Maturities of sovereign risks European Union | Millions of euros | |||||||
|---|---|---|---|---|---|---|---|---|
| 2011 | ||||||||
| Debt securities | Loans and Receivables | Derivatives | Total | % | ||||
| Financial Assets Held-for-Trading | Available-for-Sale Financial Assets | Held-to-Maturity Investments | Direct Exposure | Indirect Exposure | ||||
| Spain |
|
|
|
|
|
|
|
|
| Up to 1 Year | 2,737 | 779 | 36 | 9,168 | 1 | - | 12,721 | 21.4% |
| 1 to 5 Years | 1,025 | 11,630 | 1,078 | 4,265 | 67 | - | 18,065 | 30.5% |
| Over 5 Years | 604 | 2,816 | 5,406 | 13,204 | 27 | - | 22,057 | 37.2% |
| Italy |
|
|
|
|
|
|
|
|
| Up to 1 Year | 172 | 22 | 3 | 89 | - | - | 286 | 0.5% |
| 1 to 5 Years | 73 | 34 | 2,378 | 20 | - | (18) | 2,487 | 4.2% |
| Over 5 Years | 105 | 578 | 575 | 75 | - | (4) | 1,329 | 2.2% |
| Rest of Europe |
|
|
|
|
|
|
|
|
| Up to 1 Year | 512 | 197 | 69 | 281 | 3 | (1) | 1,061 | 1.8% |
| 1 to 5 Years | 224 | 233 | 61 | 18 | (1) | 1 | 536 | 0.9% |
| Over 5 Years | 309 | 140 | 290 | 62 | (8) | (11) | 782 | 1.3% |
| Total Exposure to European Union Sovereign Counterparties | 5,761 | 16,429 | 9,896 | 27,182 | 89 | (34) | 59,323 | 100.0% |
Valuation and impairment methods
The valuation methods used to assess the instruments that are subject to sovereign risks are the same ones used for other instruments included in the same portfolios. They are detailed in Note 8 of these Financial Statements, taking into account the exceptional circumstances that have taken place over the last two years in connection with the sovereign debt crisis in Europe.
Specifically, the fair value of sovereign debt securities of European countries has been considered equivalent to their listed price in active markets (Level 1 as defined in Note 8), except for Greek sovereign debt securities.
With regard to sovereign debt securities issued by Greece, owing to its economic situation and considering the various agreements reached at the summits of European leaders on the plan for restructuring Greek debt, the Group has recognized impairment losses on these assets for a total amount of €81 million, applying an expected loss of 50% of the nominal value of the Greek debt, irrespective of its maturity. This impairment has been estimated by considering the recommendations issued by the European Securities and Markets Authority (ESMA). These impairment losses are charged to the consolidated income statement for 2011.
Reclassification of securities between portfolios
Note 14 describes the reclassification carried out in the third quarter of 2011, in accordance with IFRS-7, amounting to €1,817 million in sovereign debt securities issued by Italy, Greece and Portugal from the heading “Available-for-sale financial assets” to the heading “Held-to-maturity investments” of the consolidated balance sheet.
7.1.6 Financial assets past due but not impaired
The table below provides details of financial assets past due as of December 31, 2011, 2010 and 2009, but not considered to be impaired, listed by their first past-due date:
| Financial Assets Past Due but Not Impaired 2011 | Millions of Euros | ||
|---|---|---|---|
| Less than 1 Months Past-Due |
1 to 2 Months Past-Due |
2 to 3 Months Past-Due |
|
| Loans and advances to credit institutions | - | - | - |
| Loans and advances to customers | 1,998 | 392 | 366 |
| Government | 186 | 47 | 23 |
| Other sectors | 1,812 | 345 | 343 |
| Debt securities | - | - | - |
| Total | 1,998 | 392 | 366 |
| Financial Assets Past Due but Not Impaired 2010 | Millions of Euros | ||
|---|---|---|---|
| Less than 1 Months Past-Due |
1 to 2 Months Past-Due |
2 to 3 Months Past-Due |
|
| Loans and advances to credit institutions | - | - | - |
| Loans and advances to customers | 1,082 | 311 | 277 |
| Government | 122 | 27 | 27 |
| Other sectors | 960 | 284 | 250 |
| Debt securities | - | - | - |
| Total | 1,082 | 311 | 277 |
| Financial Assets Past Due but Not Impaired 2009 | Millions of Euros | ||
|---|---|---|---|
| Less than 1 Months Past-Due |
1 to 2 Months Past-Due |
2 to 3 Months Past-Due |
|
| Loans and advances to credit institutions | - | - | - |
| Loans and advances to customers | 2,653 | 336 | 311 |
| Government | 45 | 32 | 19 |
| Other sectors | 2,608 | 304 | 292 |
| Debt securities | - | - | - |
| Total | 2,653 | 336 | 311 |
7.1.7 Impaired assets and impairment losses
The table below shows the composition of the impaired financial assets and risks as of December 31, 2011, 2010 and 2009, broken down by heading in the accompanying consolidated balance sheet:
| Impaired Risks. Breakdown by Type of Asset and by Sector |
Millions of Euros | ||
|---|---|---|---|
| 2011 | 2010 | 2009 | |
| Asset Instruments Impaired |
|
|
|
| Available-for-sale financial assets | 125 | 140 | 212 |
| Debt securities | 125 | 140 | 212 |
| Loans and receivables | 15,685 | 15,472 | 15,311 |
| Loans and advances to credit institutions | 28 | 101 | 100 |
| Loans and advances to customers | 15,647 | 15,361 | 15,197 |
| Debt securities | 10 | 10 | 14 |
| Total Asset Instruments Impaired (1) | 15,810 | 15,612 | 15,523 |
| Contingent Risks Impaired |
|
|
|
| Contingent Risks Impaired (2) | 219 | 324 | 405 |
| Total impaired risks (1) + (2) | 16,029 | 15,936 | 15,928 |
| Of which: |
|
|
|
| Goverment | 135 | 124 | 87 |
| Credit institutions | 84 | 129 | 172 |
| Other sectors | 15,590 | 15,360 | 15,264 |
| Mortgage | 9,639 | 8,627 | 7,932 |
| With partial secured loans | 83 | 159 | 37 |
| Rest | 5,868 | 6,574 | 7,295 |
| Contingent Risks Impaired | 219 | 324 | 405 |
| Total impaired risks (1) + (2) | 16,029 | 15,936 | 15,928 |
The changes in 2011, 2010 and 2009 in the impaired financial assets and contingent risks are as follows:
| Changes in Impaired Financial Assets and Contingent Risks | Millions of Euros | ||
|---|---|---|---|
| 2011 | 2010 | 2009 | |
| Balance at the beginning | 15,936 | 15,928 | 8,859 |
| Additions (1) | 13,045 | 13,207 | 17,298 |
| Recoveries (2) | (9,079) | (9,138) | (6,524) |
| Net additions (1)+(2) | 3,966 | 4,069 | 10,774 |
| Transfers to write-off | (4,093) | (4,307) | (3,737) |
| Exchange differences and other | 221 | 246 | 32 |
| Balance at the end | 16,029 | 15,936 | 15,928 |
| Recoveries on entries (%) | 70 | 69 | 38 |
Below are details of the impaired financial assets as of December 31, 2011 and 2010, classified by geographical area and by the time since their oldest past-due amount or the period since they were deemed impaired:
| Impaired Assets by Geographic Area and Time Since Oldest Past-Due Amount 2011 | Millions of Euros | ||||
|---|---|---|---|---|---|
| Less than 6 Months Past-Due |
6 to 9 Months Past-Due |
9 to 12 Months Past-Due |
More than 12 Months Past-Due |
Total | |
| Spain | 4,640 | 1,198 | 1,187 | 4,482 | 11,507 |
| Rest of Europe | 217 | 38 | 41 | 235 | 531 |
| Mexico | 809 | 141 | 130 | 199 | 1,280 |
| South América | 767 | 66 | 38 | 109 | 980 |
| The United States | 634 | 211 | 117 | 549 | 1,511 |
| Rest of the world | - | - | - | 1 | 1 |
| Total | 7,068 | 1,653 | 1,513 | 5,572 | 15,810 |
| Impaired Assets by Geographic Area and Time Since Oldest Past-Due Amount 2010 | Millions of Euros | ||||
|---|---|---|---|---|---|
| Less than 6 Months Past-Due |
6 to 9 Months Past-Due |
9 to 12 Months Past-Due |
More than 12 Months Past-Due |
Total | |
| Spain | 5,279 | 1,064 | 798 | 4,544 | 11,685 |
| Rest of Europe | 106 | 24 | 24 | 55 | 209 |
| Mexico | 753 | 60 | 69 | 324 | 1,206 |
| South América | 720 | 51 | 31 | 74 | 876 |
| The United States | 1,110 | 84 | 111 | 331 | 1,636 |
| Rest of the world | - | - | 1 | - | - |
| Total | 7,968 | 1,284 | 1,034 | 5,327 | 15,612 |
Below are details of the impaired financial assets as on December 31, 2011 and 2010, classified by type of loan in accordance with its associated guarantee, and by the time since their oldest past-due amount or the period since they were deemed impaired:
| Impaired Assets by Type of Guarantees and Time Since Oldest Past-Due Amount 2011 | Millions of Euros | ||||
|---|---|---|---|---|---|
| Less than 6 Months Past-Due |
6 to 9 Months Past-Due |
9 to 12 Months Past-Due |
More than 12 Months Past-Due |
Total | |
| Unsecured loans | 3,414 | 598 | 534 | 1,541 | 6,087 |
| Mortgage | 3,570 | 1,055 | 979 | 4,033 | 9,639 |
| Residential mortgage | 1,080 | 390 | 357 | 1,373 | 3,200 |
| Commercial mortgage (rural properties in operation and offices, and industrial buildings) | 630 | 210 | 160 | 795 | 1,795 |
| Other than those currently use as a family residential property of the borrower | 490 | 138 | 167 | 659 | 1,454 |
| Plots and other real state assets | 1,370 | 317 | 295 | 1,206 | 3,188 |
| Other partially secured loans | 83 | - | - | - | 83 |
| Others | - | - | - | - | - |
| Total | 7,067 | 1,653 | 1,513 | 5,574 | 15,810 |
| Impaired Assets by Type of Guarantees and Time Since Oldest Past-Due Amount 2010 | Millions of Euros | ||||
|---|---|---|---|---|---|
| Less than 6 Months Past-Due |
6 to 9 Months Past-Due |
9 to 12 Months Past-Due |
More than 12 Months Past-Due |
Total | |
| Unsecured loans | 4,309 | 338 | 271 | 1,710 | 6,628 |
| Mortgage | 3,301 | 946 | 763 | 3,617 | 8,627 |
| Residential mortgage | 629 | 304 | 271 | 1,472 | 2,676 |
| Commercial mortgage (rural properties in operation and offices, and industrial buildings) | 561 | 128 | 100 | 602 | 1,391 |
| Rest of residential mortgage | 701 | 132 | 99 | 593 | 1,525 |
| Plots and other real state assets | 1,410 | 382 | 293 | 950 | 3,035 |
| Other partially secured loans | 159 | - | - | - | 159 |
| Others | 198 | - | - | - | 198 |
| Total | 7,967 | 1,284 | 1,034 | 5,327 | 15,612 |
Below is the accumulated financial income accrued as of 31 December 2011, 2010 and 2009 with origin in the impaired assets that, as mentioned above in Note 2.2.1, are not recognized in the accompanying consolidated income statements as there are doubts as to the possibility of collection:
|
|
Millions of Euros | ||
|---|---|---|---|
| 2011 | 2010 | 2009 | |
| Financial Income from Impaired Assets | 1,908 | 1,717 | 1,485 |
As of December 31, 2011, 2010 and 2009, the non-performing loan and coverage ratios (see Glossary) of the transactions registered under the "Loans and advances to customers” and “Contingent risk" headings of the accompanying consolidated balance sheets were:
| BBVA Group Ratios | Percentage (%) | ||
|---|---|---|---|
| 2011 | 2010 | 2009 | |
| NPA ratio | 4.0 | 4.1 | 4.3 |
| NPA coverage ratio | 61 | 62 | 57 |
7.1.8 Impairment losses
Below is a breakdown of the provisions recorded on the accompanying consolidated balance sheets to cover estimated impairment losses as of December 31, 2011, 2010 and 2009 in financial assets and contingent risks, according to the different headings under which they are classified in the accompanying consolidated balance sheet:
| Impairment losses and provisions for contingent risks | Notes | Millions of Euros | ||
|---|---|---|---|---|
| 2011 | 2010 | 2009 | ||
| Available-for-sale portfolio | 12 | 569 | 619 | 449 |
| Loans and receivables | 13 | 9,469 | 9,473 | 8,805 |
| Loans and advances to customers | 13.2 | 9,410 | 9,396 | 8,720 |
| Loans and advances to credit institutions | 13.1 | 47 | 67 | 68 |
| Debt securities | 13.3 | 12 | 10 | 17 |
| Held to maturity investment | 14 | 1 | 1 | 1 |
| Impairment losses |
|
10,039 | 10,093 | 9,255 |
| Provisions for Contingent Risks and Commitments | 25 | 291 | 264 | 243 |
| Total |
|
10,330 | 10,357 | 9,498 |
| Of which: |
|
|
|
|
| For impaired portfolio |
|
7,058 | 7,507 | 6,549 |
| For currently non-impaired portfolio |
|
3,272 | 2,850 | 2,949 |
Below are the changes in 2011 and 2010 in the estimated impairment losses, broken down by the headings in the accompanying consolidated balance sheet:
| 2011 | Notes | Millions of Euros | ||||
|---|---|---|---|---|---|---|
| Available-for-sale porfolio | Held to maturity investment | Loans and receivables | Contingent Risks and Commitments | Total | ||
| Balance at the beginning |
|
619 | 1 | 9,473 | 264 | 10,356 |
| Increase in impairment losses charged to income |
|
62 | - | 6,041 | 17 | 6,121 |
| Decrease in impairment losses credited to income |
|
(37) | - | (1,513) | (24) | (1,574) |
| Impairment losses (net) | 48-49 | 25 | - | 4,528 | (6) | 4,547 |
| Entities incorporated in the year |
|
- | - | 305 | 12 | 318 |
| Transfers to written-off loans |
|
(75) | - | (4,039) | - | (4,114) |
| Exchange differences and other |
|
- | - | (798) | 22 | (776) |
| Balance at the end |
|
569 | 1 | 9,469 | 291 | 10,330 |
| 2010 | Notes | Millions of Euros | ||||
|---|---|---|---|---|---|---|
| Available-for-sale porfolio | Held to maturity investment | Loans and receivables | Contingent Risks and Commitments | Total | ||
| Balance at the beginning |
|
449 | 1 | 8,805 | 243 | 9,498 |
| Increase in impairment losses charged to income |
|
187 | - | 7,020 | 62 | 7,268 |
| Decrease in impairment losses credited to income |
|
(32) | - | (2,204) | (40) | (2,276) |
| Impairment losses (net) | 48-49 | 155 | - | 4,816 | 22 | 4,993 |
| Transfers to written-off loans |
|
(57) | - | (4,431) | - | (4,488) |
| Exchange differences and other |
|
72 | - | 283 | (1) | 354 |
| Balance at the end |
|
619 | 1 | 9,473 | 264 | 10,357 |
The changes in 2011, 2010 and 2009 in financial assets derecognized from the accompanying consolidated balance sheet as their recovery is considered unlikely (hereinafter “write-offs”) is shown below:
| Changes in Impaired Financial Assets Written-Off from the Balance Sheet | Millions of Euros | ||
|---|---|---|---|
| 2011 | 2010 | 2009 | |
| Balance at the beginning | 13,367 | 9,834 | 6,872 |
| Increase: | 4,284 | 4,788 | 3,880 |
| Decrease: | (1,895) | (1,447) | (1,172) |
| Re-financing or restructuring | (4) | (1) | - |
| Cash recovery | (327) | (253) | (188) |
| Foreclosed assets | (29) | (5) | (48) |
| Sales of written-off | (840) | (342) | (590) |
| Debt forgiveness | (604) | (217) | (114) |
| Expiry and other causes | (91) | (629) | (231) |
| Net exchange differences | 115 | 193 | 253 |
| Balance at the end | 15,871 | 13,367 | 9,834 |
As indicated in Note 2.2.1, although they have been derecognized from the balance sheet, the BBVA Group continues to attempt to collect on these write-offs, until the rights to receive them are fully extinguished, either because it is time-barred debt, the debt is forgiven, or other reasons.
7.2 Market risk
As well as the most common market risks (mentioned earlier), other market risks have to be considered for the administration of certain positions: credit spread risk, basis risk, volatility and correlation risk.
Value at Risk (VaR) is the basic measure to manage and control the BBVA Group’s market risks. It estimates the maximum loss, with a given confidence level, that can be produced in market positions of a portfolio within a given time horizon. VaR is calculated in the Group at a 99% confidence level and a 1-day time horizon.
BBVA and BBVA Bancomer have received approval from the Bank of Spain to use a model developed by the BBVA Group to calculate bank capital requirements for market risk. This model estimates VaR in accordance with the “historical simulation” methodology, which consists of estimating the losses or gains that would have been produced in the current portfolio if the changes in market conditions occurring over a specific period of time were repeated. Using this information, it infers the maximum foreseeable loss in the current portfolio with a determined level of confidence. It presents the advantage of precisely reflecting the historical distribution of the market variables and not requiring any assumption of specific probability distribution. The historical period used in this model is two years.
In addition, the Bank follows the guidelines set out by Spanish and European authorities regarding other metrics to meet the Bank of Spain’s regulatory requirements. The new measurements of market risk for the trading portfolio include the calculation of stressed VaR (which quantifies the level of risk in extreme historical situations) and the quantification of default risks and downgrading of credit ratings of bonds and credit portfolio derivatives.
The limit structure of the BBVA Group's market risk determines a system of VaR and economic capital limits by market risk for each business unit, with specific ad-hoc sub-limits by type of risk, activity and trading desk.
Validity tests are performed periodically on the risk measurement models used by the Group. They estimate the maximum loss that could have been incurred in the positions assessed with a certain level of probability (backtesting), as well as measurements of the impact of extreme market events on risk positions (stress testing). In addition, BBVA Research (the BBVA Group's Research Department) carries out stress analysis by simulating historical crisis scenarios and evaluating the impacts resulting from profound market alterations.
Trends in market risk in 2011 -
The changes in the BBVA Group’s market risk in 2011, measured as VaR without smoothing (see Glossary) with a 99% confidence level and a 1-day horizon are as follows:
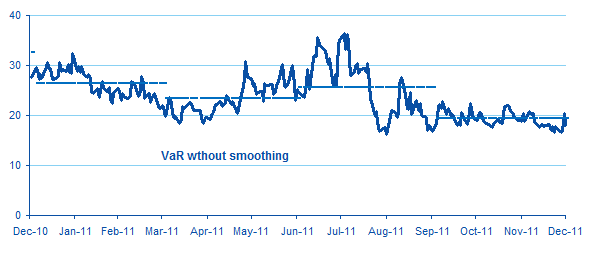
This represents a daily average VaR of €24 million in 2011, compared with €33 million in 2010 and €26 million in 2009. The number of risk factors currently used to measure portfolio risk is around 2,200. This number varies according to the possibility of doing business with other underlying assets and in other markets.
As of December 31, 2011, 2010 and 2009, VaR amounted to €18 million, €28 million and €31 million, respectively. These figures can be broken down as follows:
| VaR by Risk Factor | Millions of Euros | ||
|---|---|---|---|
| 2011 | 2010 | 2009 | |
| Interest/Spread risk | 27 | 29 | 38 |
| Currency risk | 3 | 3 | 2 |
| Stock-market risk | 7 | 4 | 9 |
| Vega/Correlation risk | 4 | 12 | 15 |
| Diversification effect(*) | (23) | (21) | (33) |
| Total | 18 | 28 | 31 |
| VaR medium in the period | 24 | 33 | 26 |
| VaR max in the period | 36 | 41 | 33 |
| VaR min in the period | 16 | 25 | 18 |
The stress testing is carried out using historical crisis scenarios and economic scenarios supplied by BBVA Research as a base:
- Historical scenarios: The base historical scenario is the collapse of Lehman Brothers in 2008.
- Economic crisis scenarios: Unlike the historical scenarios, economic stress scenarios are updated monthly. The decision about which of the scenarios should be used is taken by the Market Stress Committee, in which BBVA Research takes an active part through the construction of ad hoc scenarios. The fundamental aim of this committee is to identify the most significant market risk positions in each of the BBVA Group's treasuries and assess the impact of changes in their risk drivers. To do so, the Stress Committee must identify and quantify unlikely but plausible crisis scenarios in the financial markets. This is achieved thanks to the participation of BBVA Research as a key member of the Committee. In addition, the economic stress scenarios are designed individually and are coherent with the positions of each of the treasuries. As a result, there may be no coherence at Group level and thus the impacts cannot be aggregated.
By type of market risk assumed by the Group’s trading portfolio, as of December 31, the main risks were interest rate and credit spread risks, which fell by €3 million on the figure for December 31, 2010. Equity risk increased by €3 million, while currency risk and volatility and correlation risk fell by €0.1 million and €8 million respectively.
The changes in the average daily VaR ratio in 2011 with respect to 2010 is basically the result of Global Market Europe reducing its average risk by 24% in 2011 (with a daily average VaR of €16 million) and, to a lesser extent, because Global Market Bancomer cut its risk by 39% (with a daily average VaR in 2011 of €5 million).
The internal market risk model is validated periodically by back testing. In 2011, portfolio losses in BBVA SA were higher than daily VaR on 3 occasions (2 in the case of BBVA Bancomer). This number of exceptions is within the bands set in the tests used in the Basel model. This is why no significant changes have been made either to the methodology of measurement, nor to the parametrics of the current measurement model.
Structural interest-rate risk -
The aim of on-balance-sheet interest rate risk management is to maintain the BBVA Group’s exposure to market interest-rate fluctuations at levels in keeping with its risk strategy and profile. In pursuance of this, the Assets and Liabilities Committee (ALCO) undertakes active balance sheet management through operations intended to optimize the levels of risk borne according to expected earnings and respect the maximum levels of accepted risk.
ALCO uses the interest-rate risk measurements performed by the Risk Area. Acting as an independent unit, the Risk Area periodically quantifies the impact that a variation of 100 basis points in market interest rates would have on the BBVA Group’s net interest income and economic value.
In addition, the Group performs probability calculations that determine the economic capital (maximum loss of economic value) and risk margin (maximum estimated loss of operating income) originating from structural interest rate risk in banking activity (excluding the Treasury area), based on interest rate curve simulation models. The Group regularly performs stress tests and sensitivity analyses to complement its assessment of its interest-rate risk profile.
All these risk measurements are subsequently analyzed and monitored. The levels of risk assumed and the degree of compliance with the limits authorized by the Executive Committee are reported to the various managing bodies of the BBVA Group.
Below are the average interest-rate risk exposure levels in terms of sensitivity of the main financial institutions in the BBVA Group in 2011:
| Sensitivity to interest-rate analysis 2011 | Impact on Net Interest Income (*) | Impact on Economic Value (**) | ||
|---|---|---|---|---|
| 100 Basis-Point Increase | 100 Basis-Point Decrease | 100 Basis-Point Increase | 100 Basis-Point Decrease | |
| Europe | 0.50% | 3.34% | 0.78% | -1.07% |
| BBVA Bancomer | 3.33% | -3.33% | 2.06% | -3.06% |
| BBVA Compass | 3.85% | -3.32% | 3.06% | -7.42% |
| BBVA Puerto Rico | 2.83% | -2.75% | -2.45% | 3.95% |
| BBVA Chile | -3.01% | 2.98% | -11.57% | 10.45% |
| BBVA Colombia | 1.24% | -1.26% | 0.17% | -0.50% |
| BBVA Banco Continental | 1.78% | -1.74% | -9.22% | 9.91% |
| BBVA Banco Provincial | 1.95% | -1.85% | -1.47% | 1.52% |
| BBVA Banco Francés | 0.69% | -0.70% | -1.35% | 1.38% |
| BBVA Group | 1.98% | 0.82% | 0.91% | -1.96% |
As part of the measurement process, the BBVA Group has established the assumptions regarding the movement and behavior of certain items, such as those relating to products with no explicit or contractual maturity. These assumptions are based on studies that estimate the relationship between the interest rates on these products and market rates. They enable specific balances to be classified into trend-based balances (long-term) and seasonal or volatile balances (short-term residual maturity).
Structural currency risk -
Structural currency risk is basically caused by exposure to variations in currency exchange rates that arise in the BBVA Group’s foreign subsidiaries and the provision of funds to foreign branches financed in a different currency to that of the investment.
ALCO is the body responsible for arranging hedging transactions to limit the capital impact of fluctuations in exchange rates, based on their projected trend, and to guarantee the equivalent euro value of the foreign currency earnings expected to be obtained from these investments.
Structural currency risk management is based on the measurements performed by the Risk Area. These measurements use an exchange-rate scenario simulation model which quantifies possible changes in value for a given confidence interval and a pre-established time horizon. The Standing Committee authorizes the system of limits and alerts for these risk measurements, which include a sub-limit on the economic capital (an unexpected loss arising from the currency risk of investments financed in foreign currency).
In 2011, the average asset exposure sensitivity to a 1% depreciation in exchange rates stood at €154 million, with 37% in the Mexican peso, 23% in South American currencies, 20% in Asian and Turkish currencies, and 18% in the US dollar.
Structural equity risk -
The BBVA Group's exposure to structural equity risk is basically derived from investments in industrial and financial companies with medium- and long-term investment horizons. This exposure is mitigated through net short positions held in derivatives of their underlying assets, used to limit portfolio sensitivity to potential falls in prices.
The aggregate sensitivity of the BBVA Group's consolidated equity to a 1% fall in the price of shares stood at €-39.4 million as of December 31, 2011, and its impact on consolidated earnings for the year is estimated at €1.8 million. These figures are estimated taking into account the exposure in shares valued at market prices, or if not applicable, at fair value (except for the positions in the Treasury Area portfolios) and the net delta-equivalent positions in options on their underlyings.
The Risk Area is responsible for measuring and effectively monitoring structural risk in the equity portfolio. To do so, it estimates the sensitivity figures and the capital necessary to cover possible unexpected losses due to the variations in the value of the companies making up the Group’s equity portfolio, at a confidence level that corresponds to the institution’s target rating, and taking into account the liquidity of the positions and the statistical performance of the assets under consideration. These figures are supplemented by periodic stress tests, back-testing and scenario analyses.
7.3 Liquidity risk
The aim of liquidity risk management, tracking and control is to ensure, in the short term, that the payment commitments of the BBVA Group entities can be duly met without having to resort to borrowing funds under burdensome terms, or damaging the image and reputation of the entities. In the medium term the aim is to ensure that the Group’s financing structure is ideal and that it is moving in the right direction with respect to the economic situation, the markets and regulatory changes.
Management of liquidity and structural finance within the BBVA Group is based on the principle of financial autonomy of the entities that make it up. This approach helps prevent and limit liquidity risk by reducing the Group’s vulnerability in periods of high risk.
The management and monitoring of liquidity risk is carried out comprehensively in each of the BBVA Group’s business units using a double (short and long-term) approach. The short-term liquidity approach has a time horizon of up to 366 days. It is focused on the management of payments and collections from the Treasury and market activity, and includes operations specific to the area and the Bank's possible liquidity requirements. The medium-term approach is focused on financial management of the whole consolidated balance sheet, with a time horizon of one year or more.
The ALCO within each management unit is responsible for the comprehensive management of liquidity. The Financial Management unit, as part of the Financial Division, analyzes the implications of the Bank’s various projects in terms of finance and liquidity and its compatibility with the target financing structure and the situation of the financial markets. The Financial Management unit executes the resolutions agreed by ALCO in accordance with the agreed budgets and manages liquidity risk using a broad scheme of limits, sub-limits and alerts approved by the Standing Committee. The Risk Area measures and controls these limits independently and provides the managers with support tools and metrics needed for decision-making.
Each of the local risk areas, which are independent from the local manager, complies with the corporative principles of liquidity risk control established by GRM, the Global Unit in charge of Structural Risks for the entire BBVA Group.
At the level of each BBVA Group entity, the managing areas request and propose a scheme of quantitative and qualitative limits and alerts related to short and medium term liquidity risks. Once agreed with GRM, controls and limits are proposed to the Bank’s Board of Directors (through its delegate bodies), for approval at least once a year. The proposals submitted by GRM are adapted to the situation of the markets according to the risk tolerance level aimed for by the Group.
The development of a new Liquidity and Finance Manual demanded strict adjustment of liquidity risk management in terms of limits, sub-limits and alerts, as well as in procedures. In accordance with the manual, GRM carries out regular measurements of risk incurred and monitors the consumption of limits. It develops management tools and adapts valuation models, carries out regular stress tests and reports on the liquidity risk levels to ALCO and the Group’s Management Committee on a monthly basis. Its reports to the management areas and GRM Management Committee are more frequent.
Under the current Contingency Plan, the frequency of communication and the nature of information provided is decided by the Liquidity Committee at the proposal of the Technical Liquidity Group (TLG). In the event of any alert or possible crisis, the TLG carries out an initial analysis of the liquidity situation (short or long term) of the entity affected.
The TLG is made up of specialized staff from the Short-Term Cash Desk, the Global Accounting & Information Management (GA&IM), the Financial Management and the Structural Risk areas. If the alert signals established make clear that a critical situation has arisen, the TLG informs the Liquidity Committee (made up of managers of the corresponding areas). The Liquidity Committee is responsible for calling the Financing Committee, if appropriate, which is made up of the Group's President and COO and the managers from the Financial Area, the Risk Area, Global Business and the Business Area of the country affected.
One of the most significant aspects that have affected the BBVA Group in 2011 was the continuation of the sovereign debt crisis, which started in 2010. The role played by official bodies in the euro zone and the ECB have been key in calming the markets and ensuring liquidity in the European banking system. However, the Group has not had to make use of the extraordinary measures established by the Spanish authorities to mitigate the liquidity tension affecting many Spanish banks.
Given this situation, the regulators have established new regulatory requirements with the aim of strengthening the balance sheets of banks and making them more resistant to potential short-term liquidity shocks. The Liquidity Coverage Ratio (LCR) is the metric proposed by the Bank Supervisory Committee of the Bank for International Settlements in Basel to achieve this objective. It aims to ensure that financial institutions have a sufficient stock of liquid assets to allow them to survive a 30-day liquidity stress scenario. According to the most recent document published by the Basel Committee on Bank Supervision in December 2010, this ratio will remain subject to revision by the regulating bodies until mid-2013, and it will be incorporated as a regulatory requirement on January 1, 2015, though it must be reported to supervisory bodies as of January 2012.
In order to increase the weight of medium and long-term funding on the banks' balance sheets, the regulators have defined a new long-term funding ratio (over 12 months) called the Net Stable Funding Ratio (NSFR). It will be under review until mid-2016 and become a regulatory requirement starting on January 1, 2018.
Although the precise definition of these new ratios has still not been decided, the BBVA Group has outlined a plan to adapt to them. This will allow it to adopt best practices and the most effective and strict criteria for their implementation sufficiently in advance.
7.4 Risk concentrations
Below is a breakdown of the balances of financial instruments registered in the accompanying consolidated balance sheets by their concentration in geographical areas and according to the residence of the customer or counterparty. It does not take into account valuation adjustments, impairment losses or loan-loss provisions:
| Risks by Geographical Areas 2011 |
Millions of Euros | ||||||
|---|---|---|---|---|---|---|---|
| Spain | Europe, Excluding Spain | México | USA | South América | Rest | Total | |
| Financial assets - |
|
|
|
|
|
|
|
| Financial assets held for trading | 12,958 | 33,305 | 11,675 | 4,672 | 5,452 | 2,539 | 70,603 |
| Debt securities | 5,075 | 2,068 | 10,933 | 565 | 2,030 | 305 | 20,975 |
| Equity instruments | 662 | 363 | 741 | 69 | 125 | 238 | 2,198 |
| Derivatives | 7,221 | 30,874 | 2 | 4,039 | 3,297 | 1,996 | 47,430 |
| Other financial assets designated at fair value through profit or loss | 234 | 311 | 1,470 | 509 | 454 | - | 2,977 |
| Debt securities | 117 | 77 | 6 | 508 | 1 | - | 708 |
| Equity instruments | 117 | 234 | 1,464 | 1 | 453 | - | 2,269 |
| Available-for-sale portfolio | 26,546 | 8,895 | 7,825 | 8,151 | 5,164 | 656 | 57,237 |
| Debt securities | 22,371 | 8,685 | 7,764 | 7,518 | 5,068 | 602 | 52,008 |
| Equity instruments | 4,175 | 210 | 61 | 633 | 96 | 54 | 5,229 |
| Loans and receivables | 203,348 | 44,305 | 42,489 | 44,625 | 46,479 | 7,704 | 388,949 |
| Loans and advances to credit institutions | 3,034 | 11,531 | 4,877 | 2,712 | 2,197 | 1,663 | 26,013 |
| Loans and advances to customers | 198,948 | 32,445 | 37,612 | 41,222 | 43,592 | 6,035 | 359,855 |
| Debt securities | 1,365 | 328 | - | 692 | 690 | 6 | 3,081 |
| Held-to-maturity investments | 7,373 | 3,582 | - | - | - | - | 10,955 |
| Hedging derivatives | 395 | 3,493 | 485 | 253 | 16 | 56 | 4,698 |
| Total Risk in Financial Assets | 250,854 | 93,890 | 63,943 | 58,210 | 57,565 | 10,955 | 535,419 |
| Contingent risks and commintments |
|
|
|||||
| Contingent risks | 16,175 | 12,289 | 1,098 | 4,056 | 4,733 | 1,554 | 39,904 |
| Contingent commitments | 30,848 | 21,506 | 11,929 | 22,002 | 6,192 | 1,288 | 93,767 |
| Total Contingent Risk | 47,023 | 33,795 | 13,027 | 26,058 | 10,925 | 2,842 | 133,669 |
| Total Risks in Financial Instruments | 297,877 | 127,685 | 76,970 | 84,268 | 68,490 | 13,797 | 669,088 |
| Risks by Geographical Areas 2010 |
Millions of Euros | ||||||
|---|---|---|---|---|---|---|---|
| Spain | Europe, Excluding Spain | México | EE.UU. | South América | Rest | Total | |
| Financial assets - |
|
|
|
|
|
|
|
| Financial assets held for trading | 18,903 | 22,899 | 9,578 | 3,951 | 5,549 | 2,404 | 63,284 |
| Debt securities | 9,522 | 2,839 | 8,853 | 654 | 2,086 | 405 | 24,359 |
| Equity instruments | 3,041 | 888 | 725 | 148 | 136 | 322 | 5,260 |
| Derivatives | 6,340 | 19,172 | - | 3,149 | 3,327 | 1,677 | 33,665 |
| Other financial assets designated at fair value through profit or loss | 284 | 98 | 1,437 | 481 | 476 | 1 | 2,777 |
| Debt securities | 138 | 66 | 7 | 480 | - | - | 691 |
| Equity instruments | 146 | 32 | 1,430 | 1 | 476 | 1 | 2,086 |
| Available-for-sale portfolio | 25,230 | 7,689 | 10,158 | 7,581 | 4,291 | 1,234 | 56,183 |
| Debt securities | 20,725 | 7,470 | 10,106 | 6,903 | 4,211 | 1,187 | 50,602 |
| Equity instruments | 4,505 | 219 | 52 | 678 | 80 | 47 | 5,581 |
| Loans and receivables | 218,399 | 30,985 | 40,540 | 39,944 | 37,320 | 5,847 | 373,035 |
| Loans and advances to credit institutions | 6,786 | 7,846 | 5,042 | 864 | 2,047 | 1,018 | 23,603 |
| Loans and advances to customers | 210,102 | 23,139 | 35,498 | 38,649 | 34,999 | 4,822 | 347,209 |
| Debt securities | 1,511 | - | - | 431 | 274 | 7 | 2,223 |
| Held-to-maturity investments | 7,504 | 2,443 | - | - | - | - | 9,947 |
| Hedging derivatives | 234 | 2,922 | 281 | 131 | - | 35 | 3,603 |
| Total Risk in Financial Assets | 270,554 | 67,036 | 61,994 | 52,088 | 47,636 | 9,521 | 508,829 |
| Contingent risks and commintments |
|
|
|||||
| Contingent risks | 20,175 | 6,773 | 1,006 | 3,069 | 3,953 | 1,465 | 36,441 |
| Contingent commitments | 35,784 | 19,144 | 11,421 | 17,604 | 5,711 | 910 | 90,574 |
| Total Contingent Risk | 55,959 | 25,917 | 12,427 | 20,673 | 9,664 | 2,375 | 127,015 |
| Total Risks in Financial Instruments | 326,513 | 92,953 | 74,421 | 72,761 | 57,300 | 11,896 | 635,844 |
| Risks by Geographical Areas 2009 |
Millions of Euros | ||||||
|---|---|---|---|---|---|---|---|
| Spain | Europe, Excluding Spain | México | EE.UU. | South América | Rest | Total | |
| Financial assets - |
|
|
|
|
|
|
|
| Financial assets held for trading | 22,893 | 25,583 | 11,612 | 3,076 | 4,329 | 2,240 | 69,733 |
| Debt securities | 14,487 | 7,434 | 10,157 | 652 | 1,646 | 296 | 34,672 |
| Equity instruments | 3,268 | 624 | 1,455 | 35 | 207 | 194 | 5,783 |
| Derivatives | 5,138 | 17,525 | - | 2,389 | 2,476 | 1,750 | 29,278 |
| Other financial assets designated at fair value through profit or loss | 330 | 73 | 1,153 | 436 | 344 | - | 2,337 |
| Debt securities | 157 | 42 | 3 | 435 | 1 | - | 639 |
| Equity instruments | 173 | 31 | 1,150 | 1 | 343 | - | 1,698 |
| Available-for-sale portfolio | 30,177 | 11,660 | 7,709 | 7,828 | 4,876 | 1,266 | 63,516 |
| Debt securities | 24,838 | 11,429 | 7,688 | 7,082 | 4,806 | 1,223 | 57,066 |
| Equity instruments | 5,339 | 231 | 21 | 746 | 70 | 43 | 6,450 |
| Loans and receivables | 206,097 | 34,613 | 31,469 | 40,469 | 34,926 | 6,167 | 353,741 |
| Loans and advances to credit institutions | 2,568 | 11,280 | 3,269 | 2,441 | 1,724 | 918 | 22,200 |
| Loans and advances to customers | 203,529 | 23,333 | 28,200 | 37,688 | 33,098 | 5,239 | 331,087 |
| Debt securities | - | - | - | 340 | 104 | 10 | 454 |
| Held-to-maturity investments | 2,625 | 2,812 | - | - | - | - | 5,437 |
| Hedging derivatives | 218 | 2,965 | 266 | 117 | 3 | 25 | 3,595 |
| Total Risk in Financial Assets | 262,340 | 77,706 | 52,210 | 51,926 | 44,478 | 9,698 | 498,359 |
| Contingent risks and commintments |
|
|
|
|
|
|
|
| Contingent risks | 15,739 | 7,826 | 897 | 3,330 | 3,704 | 1,689 | 33,185 |
| Contingent commitments | 37,804 | 24,119 | 9,421 | 15,990 | 3,743 | 1,246 | 92,323 |
| Total Contingent Risk | 53,543 | 31,945 | 10,318 | 19,320 | 7,447 | 2,935 | 125,508 |
| Total Risks in Financial Instruments | 315,883 | 109,651 | 62,528 | 71,246 | 51,925 | 12,633 | 623,866 |
The breakdown of the main figures in the most significant foreign currencies in the accompanying consolidated balance sheets is set forth in Appendix IX.
7.5 Residual maturity
Below is a breakdown by contractual maturity of the balances of certain headings in the accompanying consolidated balance sheets, disregarding any valuation adjustments or impairment losses:
| Contractual Maturities 2011 |
Millions of Euros | ||||||
|---|---|---|---|---|---|---|---|
| Demand | Up to 1 Month | 1 to 3 Months | 3 to 12 Months | 1 to 5 Years | Over 5 years | Total | |
| Asset - |
|
|
|
|
|
|
|
| Cash and balances with central banks | 28,066 | 1,444 | 660 | 330 | 426 | - | 30,927 |
| Loans and advances to credit institutions | 2,771 | 7,551 | 1,393 | 3,723 | 7,608 | 2,967 | 26,013 |
| Loans and advances to customers | 18,021 | 38,741 | 22,887 | 45,818 | 93,138 | 141,251 | 359,855 |
| Debt securities | 842 | 2,297 | 2,761 | 8,025 | 39,603 | 34,199 | 87,727 |
| Derivatives (trading and hedging) | - | 1,798 | 1,877 | 4,704 | 16,234 | 27,368 | 51,981 |
| Liabilities - |
|
|
|
|
|
|
|
| Deposits from central banks | 3 | 19,463 | 2,629 | - | 11,040 | 1 | 33,136 |
| Deposits from credit institutions | 2,202 | 27,266 | 4,374 | 5,571 | 15,964 | 3,669 | 59,047 |
| Deposits from customers | 116,924 | 69,738 | 17,114 | 41,397 | 28,960 | 6,861 | 280,994 |
| Debt certificates (including bonds) | - | 2,032 | 1,880 | 11,361 | 45,904 | 17,144 | 78,321 |
| Subordinated liabilities | - | - | 110 | 38 | 4,893 | 9,500 | 14,541 |
| Other financial liabilities | 5,015 | 1,283 | 355 | 490 | 1,254 | 1,307 | 9,704 |
| Short positions | - | 1,446 | 2 | - | - | 3,163 | 4,611 |
| Derivatives (trading and hedging) | - | 1,687 | 1,636 | 5,232 | 15,533 | 25,313 | 49,401 |
| Contractual Maturities 2010 |
Millions of Euros | ||||||
|---|---|---|---|---|---|---|---|
| Demand | Up to 1 Month | 1 to 3 Months | 3 to 12 Months | 1 to 5 Years | Over 5 Years | Total | |
| Asset - |
|
|
|
|
|
|
|
| Cash and balances with central banks | 17,275 | 1,497 | 693 | 220 | 282 | - | 19,967 |
| Loans and advances to credit institutions | 2,471 | 10,590 | 1,988 | 1,658 | 4,568 | 2,329 | 23,604 |
| Loans and advances to customers | 16,543 | 33,397 | 21,127 | 49,004 | 85,800 | 141,338 | 347,209 |
| Debt securities | 497 | 3,471 | 12,423 | 8,123 | 35,036 | 28,271 | 87,821 |
| Derivatives (trading and hedging) | - | 636 | 1,515 | 3,503 | 13,748 | 17,827 | 37,229 |
| Liabilities - |
|
|
|
|
|
|
|
| Deposits from central banks | 50 | 5,102 | 3,130 | 2,704 | - | 1 | 10,987 |
| Deposits from credit institutions | 4,483 | 30,031 | 4,184 | 3,049 | 9,590 | 5,608 | 56,945 |
| Deposits from customers | 111,090 | 69,625 | 21,040 | 45,110 | 21,158 | 6,818 | 274,841 |
| Debt certificates (including bonds) | 96 | 5,243 | 10,964 | 7,159 | 42,907 | 15,843 | 82,212 |
| Subordinated liabilities | - | 537 | 3 | 248 | 2,732 | 13,251 | 16,771 |
| Other financial liabilities | 4,177 | 1,207 | 175 | 433 | 647 | 1,564 | 8,203 |
| Short positions | - | 651 | - | 10 | - | 3,385 | 4,046 |
| Derivatives (trading and hedging) | - | 826 | 1,473 | 3,682 | 12,813 | 16,037 | 34,831 |
| Contractual Maturities 2009 |
Millions of Euros | ||||||
|---|---|---|---|---|---|---|---|
| Demand | Up to 1 Month | 1 to 3 Months | 3 to 12 Months | 1 to 5 Years | Over 5 Years | Total | |
| Asset - | - | - | - | - | - | - | - |
| Cash and balances with central banks | 14,650 | 535 | 248 | 735 | 163 | - | 16,331 |
| Loans and advances to credit institutions | 3,119 | 8,484 | 1,549 | 1,914 | 4,508 | 2,626 | 22,200 |
| Loans and advances to customers | 4,313 | 31,155 | 19,939 | 40,816 | 94,686 | 140,178 | 331,087 |
| Debt securities | 1,053 | 4,764 | 15,611 | 10,495 | 37,267 | 29,080 | 98,270 |
| Derivatives (trading and hedging) | - | 637 | 2,072 | 3,863 | 13,693 | 12,608 | 32,873 |
| Liabilities - | - | - | - | - | - | - | - |
| Deposits from central banks | 213 | 4,807 | 3,783 | 12,293 | - | - | 21,096 |
| Deposits from credit institutions | 1,836 | 24,249 | 5,119 | 5,145 | 6,143 | 6,453 | 48,945 |
| Deposits from customers | 106,942 | 55,482 | 34,329 | 32,012 | 18,325 | 6,293 | 253,383 |
| Debt certificates (including bonds) | - | 10,226 | 16,453 | 15,458 | 40,435 | 14,614 | 97,186 |
| Subordinated liabilities | - | 500 | 689 | 2 | 1,529 | 14,585 | 17,305 |
| Other financial liabilities | 3,825 | 822 | 141 | 337 | 480 | 20 | 5,625 |
| Short positions | - | 448 | - | 16 | - | 3,366 | 3,830 |
| Derivatives (trading and hedging) | - | 735 | 1,669 | 3,802 | 13,585 | 10,517 | 30,308 |