This area comprises the banking, pensions and insurance business conducted in Mexico by the BBVA Bancomer Financial Group (BBVA Bancomer).
In 2010 the Mexican economy showed signs of a steady recovery, as detailed in the Economic Background section of this Report, with GDP growth around 5% and inflation lower than expected by the Bank of Mexico, at 4.4%. Even so, we can expect the Bank of Mexico to maintain its monetary pause at least throughout 2011, when the policy rate is expected to remain at 4.5%.
With respect to the exchange rate, the Mexican peso has gained against the euro both in fixing (14.4%) and average (12.3%) rates. This has a positive impact on the financial statements in the area. As is usually the case, the figures below are given at constant exchange rates, unless indicated otherwise, and both scenarios can be seen in the adjoining tables of income statements and balance sheets.
In this environment of gradual economic recovery, BBVA Bancomer has presented very sound revenue figures that set it apart from its main competitors. Net interest income saw steady progress throughout the year, reflecting the improvement in commercial activity, and closed 2010 at €3,688m, a similar level to 2009. Net fees and commissions increased at a year-on-year rate of 1.9% to €1,233m, boosted mainly by the fees charged by mutual and pension funds. Together with the positive results obtained in the insurance business, this performance has helped gross income to increase slightly on the 2009 figure, at €5,496m, despite the reduced contribution from net trading income (–5.1%).
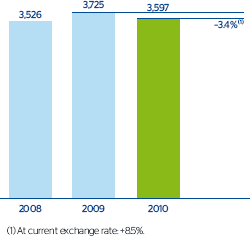
Operating expenses stood at €1,899m, with a year-on-year increase of 8.8% due to greater investments in technology and infrastructure and the launch of a strategic growth plan that will be in force over the coming two years. The income and expenses figures have ensured an efficiency ratio of 34.6%, among the lowest in the Mexican Banking system. Operating income stands at €3,597m, a decrease of 3.4% on the figure the previous year. However, it increased by 8.5% if we take into account the exchange-rate impact.
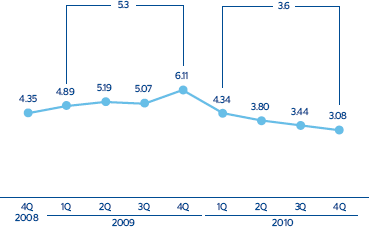
One of the items in the income statement to improve most over 2010 is impairment losses on financial assets, which fell by 28.2% over the year to €1,229m. Loan-loss provisions were down year-on-year in all segments of the portfolio, particularly in the case of credit cards. As a result, the risk premium has continued to fall since the start of 2010 and closed the year at 3.6% (5.3% a year before). It is also important to note that the favorable trend in loan-loss provisions has not had a negative impact on coverage in the area, which progressed to 152% as of 31-Dec-2010, 22 percentage points up on the figure on 31-Dec-2009. There has also been an improvement in the NPA ratio, which closed the year at 3.2%, 1.1 percentage points below the figure on 31-Dec-2009.
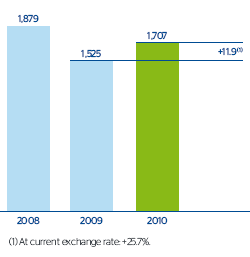
Stable income and lower loan-loss provisions meant that in 2010, which was a transition year towards recovery, BBVA Bancomer’s pre-tax profit grew year-on-year by 14.7% to €2,281m. This positive note can also be seen in the net attributable profit, which was up 11.9% to €1,707m. This is despite the increases in January 2010 in the rate of income tax from 28% to 30% and value added tax from 15% to 16%.
Income statement
(Million euros)
Download
| |
Mexico |
Units |
| |
|
Banking business |
Pensions and Insurance |
| |
2010 |
D% |
D% (1) |
2009 |
2008 |
2010 |
D% |
D% (1) |
2009 |
2010 |
D% |
D% (1) |
2009 |
| NET INTEREST INCOME |
3,688 |
11.5 |
(0.7) |
3,307 |
3,707 |
3,623 |
11.4 |
(0.8) |
3,251 |
61 |
14.5 |
2.0 |
53 |
| Net fees and commissions |
1,233 |
14.5 |
1.9 |
1,077 |
1,189 |
1,150 |
12.3 |
(0.0) |
1,024 |
79 |
55.1 |
38.1 |
51 |
| Net trading income |
395 |
6.6 |
(5.1) |
370 |
375 |
283 |
6.2 |
(5.5) |
266 |
112 |
8.0 |
(3.9) |
104 |
| Other income/expenses |
179 |
54.8 |
37.9 |
116 |
155 |
(144) |
9.5 |
(2.5) |
(131) |
340 |
32.5 |
17.9 |
256 |
| GROSS INCOME |
5,496 |
12.8 |
0.5 |
4,870 |
5,426 |
4,912 |
11.3 |
(0.9) |
4,411 |
591 |
27.4 |
13.5 |
464 |
| Operating costs |
(1,899) |
22.2 |
8.8 |
(1,554) |
(1,803) |
(1,758) |
23.5 |
10.0 |
(1,423) |
(149) |
16.9 |
4.1 |
(127) |
| Personnel expenses |
(856) |
18.1 |
5.2 |
(725) |
(845) |
(784) |
18.7 |
5.7 |
(661) |
(71) |
12.7 |
0.4 |
(63) |
| General and administrative expenses |
(956) |
25.2 |
11.5 |
(764) |
(886) |
(890) |
27.2 |
13.3 |
(699) |
(75) |
21.1 |
7.8 |
(62) |
| Depreciation and amortization |
(86) |
32.5 |
18.0 |
(65) |
(73) |
(84) |
33.0 |
18.4 |
(63) |
(3) |
21.0 |
7.7 |
(2) |
| OPERATING INCOME |
3,597 |
8.5 |
(3.4) |
3,316 |
3,623 |
3,153 |
5.5 |
(6.0) |
2,988 |
442 |
31.4 |
17.0 |
336 |
| Impairment on financial assets (net) |
(1,229) |
(19.4) |
(28.2) |
(1,525) |
(1,110) |
(1,229) |
(19.4) |
(28.2) |
(1,525) |
- |
- |
- |
- |
| Provisions (net) and other gains (losses) |
(87) |
n.m. |
261.2 |
(21) |
(24) |
(86) |
n.m. |
273.3 |
(21) |
- |
n.m. |
n.m. |
(1) |
| INCOME BEFORE TAX |
2,281 |
28.8 |
14.7 |
1,770 |
2,488 |
1,838 |
27.4 |
13.4 |
1,442 |
442 |
31.6 |
17.1 |
336 |
| Income tax |
(570) |
38.8 |
23.6 |
(411) |
(557) |
(448) |
37.8 |
22.7 |
(325) |
(122) |
38.8 |
23.6 |
(88) |
| NET INCOME |
1,711 |
25.8 |
12.0 |
1,360 |
1,931 |
1,390 |
24.4 |
10.8 |
1,118 |
320 |
29.0 |
14.9 |
248 |
| Non-controlling interests |
(4) |
89.5 |
68.7 |
(2) |
(1) |
- |
- |
- |
- |
(3) |
43.4 |
27.7 |
(2) |
| NET ATTRIBUTABLE PROFIT |
1,707 |
25.7 |
11.9 |
1,357 |
1,930 |
1,390 |
24.4 |
10.8 |
1,117 |
317 |
28.9 |
14.8 |
246 |
(1) At constant exchange rate.
Balance sheet
(Million euros)
Download
| |
31-12-10 |
D% |
D% (1) |
31-12-09 |
31-12-08 |
31-12-10 |
D% |
D% (1) |
31-12-09 |
31-12-10 |
D% |
D% (1) |
31-12-09 |
| Cash and balances with central banks |
6,365 |
2.1 |
(10.7) |
6,236 |
5,387 |
6,365 |
2.1 |
(10.7) |
6,236 |
- |
- |
- |
- |
| Financial assets |
25,737 |
9.2 |
(4.5) |
23,564 |
20,902 |
20,946 |
4.5 |
(8.7) |
20,053 |
5,050 |
35.6 |
18.6 |
3,725 |
| Loans and receivables |
40,277 |
30.9 |
14.5 |
30,764 |
32,155 |
40,029 |
30.7 |
14.3 |
30,619 |
302 |
53.8 |
34.5 |
196 |
| . Loans and advances to customers |
34,743 |
26.9 |
11.0 |
27,373 |
27,161 |
34,626 |
26.9 |
10.9 |
27,293 |
152 |
59.7 |
39.7 |
95 |
| . Loans and advances to credit institutions and other |
5,535 |
63.2 |
42.7 |
3,391 |
4,995 |
5,402 |
62.4 |
42.0 |
3,326 |
150 |
48.4 |
29.7 |
101 |
| Tangible assets |
887 |
17.8 |
3.0 |
753 |
709 |
880 |
17.8 |
3.0 |
747 |
8 |
14.7 |
0.3 |
7 |
| Other assets |
1,886 |
22.7 |
7.3 |
1,536 |
1,620 |
2,206 |
21.3 |
6.0 |
1,819 |
160 |
42.2 |
24.3 |
113 |
| TOTAL ASSETS / LIABILITIES AND EQUITY |
75,152 |
19.6 |
4.6 |
62,855 |
60,774 |
70,425 |
18.4 |
3.6 |
59,474 |
5,520 |
36.6 |
19.5 |
4,041 |
| Deposits from central banks and credit institutions |
12,933 |
21.5 |
6.3 |
10,641 |
9,160 |
12,933 |
21.5 |
6.3 |
10,641 |
- |
- |
- |
- |
| Deposits from customers |
37,013 |
15.7 |
1.2 |
31,998 |
32,467 |
37,033 |
15.6 |
1.1 |
32,037 |
- |
- |
- |
- |
| Debt certificates |
3,861 |
21.1 |
5.9 |
3,187 |
3,127 |
3,861 |
21.1 |
5.9 |
3,187 |
- |
- |
- |
- |
| Subordinated liabilities |
2,014 |
34.4 |
17.5 |
1,499 |
1,606 |
2,474 |
32.9 |
16.2 |
1,862 |
- |
- |
- |
- |
| Financial liabilities held for trading |
4,855 |
18.9 |
3.9 |
4,085 |
4,110 |
4,855 |
18.9 |
3.9 |
4,085 |
- |
- |
- |
- |
| Other liabilities |
10,992 |
25.2 |
9.5 |
8,780 |
7,461 |
6,121 |
16.4 |
1.8 |
5,259 |
5,231 |
37.0 |
19.8 |
3,818 |
| Economic capital allocated |
3,483 |
30.7 |
14.3 |
2,664 |
2,843 |
3,148 |
31.0 |
14.5 |
2,403 |
289 |
30.0 |
13.6 |
223 |
(1) At constant exchange rate.
Mexico. BBVA Bancomer and Mexican banking system efficiency
(Million mexican pesos)
|
2010
BBVA Bancomer |
Jan-Sep 2010
Mexican banking system |
| Net interest income |
61,727 |
102,620 |
| Net fees and commissions |
20,641 |
35,565 |
| Net trading income |
6,598 |
8,593 |
| Rest of revenues |
3,003 |
5,475 |
| Gross income |
91,968 |
152,253 |
| Total operating costs |
31,788 |
76,833 |
| Efficiency ratio |
34.6% |
50.5% |
(1) Banamex, Santander Conso, Banorte, HSBC and Scotiabank.
Relevant business indicators
(Million euros and percentages)
Download
| |
Mexico |
| |
31-12-10 |
D% |
D% (1) |
31-12-09 |
31-12-08 |
| Total lending to customers (gross) |
36,526 |
26.0 |
10.2 |
28,996 |
28,657 |
| Customer deposits (2) |
38,051 |
21.8 |
6.5 |
31,252 |
29,677 |
| Off-balance sheet funds |
28,122 |
40.2 |
22.6 |
20,065 |
16,376 |
| . Mutual funds |
15,341 |
45.5 |
27.2 |
10,546 |
9,180 |
| . Pension funds |
12,781 |
34.3 |
17.4 |
9,519 |
7,196 |
| Other placements |
3,127 |
12.4 |
(1.7) |
2,781 |
2,830 |
| Efficiency ratio (%) |
34.6 |
|
|
31.9 |
33.2 |
| NPA ratio (%) |
3.2 |
|
|
4.3 |
3.2 |
| Coverage ratio (%) |
152 |
|
|
130 |
161 |
(1) At constant exchange rate.
(2) Excluding deposits and Bancomer´s Market unit repos.
18: Mexico. Operating income
(Million euros at constant exchange rate)
19: Mexico. Risk premium
(Percentage)
20: Mexico. NPA and coverage ratio
(Percentage)
21: Mexico. Net attributable profit
(Million euros at constant exchange rate)