2010: a good year for the BBVA Group
Earnings strength: 4,606 million euros (+9.4%)
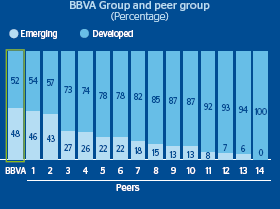
1. Income diversification: balanced business portfolio with potential
2. Costs, anticipation for new growth cycle...
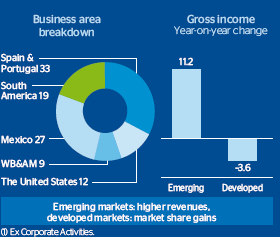
1. Gross income breakdown and evolution
(Percentage)
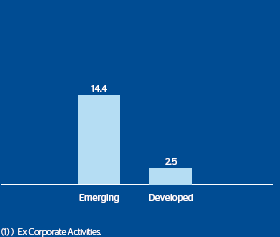
2. Costs breakdown. Year-on-year change
(Percentage)
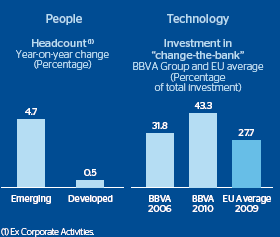
3. ... Investing in people and technology ...
4. ... And anticipation in loss provisioning.
3. Wider distribution network in expanding franchises
4. Loan-loss provisions
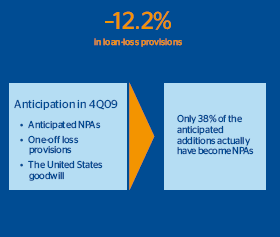
Good performance in risk: –19 basis points in NPA ratio –61% net additions to NPA
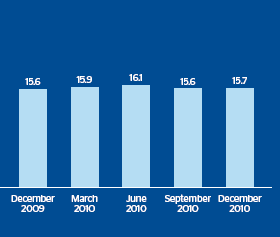
5. Balance of NPAs stabilizes ...
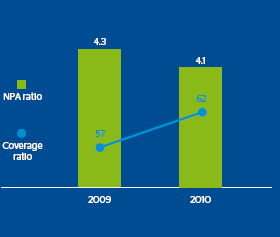
6 and 7. ... And all risk indicators are improving.
5. Balance of NPAs
(Billion euros)
6. NPA and coverage ratios
(Percentage)
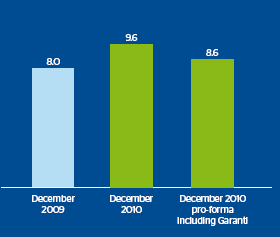
8. Stronger capital adequacy.
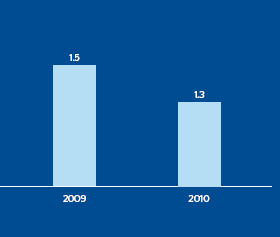
7. Overall risk premium
(Percentage)
8. Core capital ratio
(Percentage)
9. Funding: not dependent on ECB ...
10. ... and appropriate financing structure.
9. Long-term maturities of wholesale finance
(Billion euros)
10. Customer deposits/total assets
(Percentage)
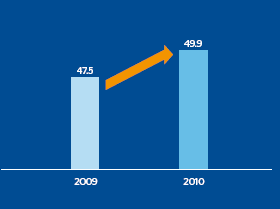

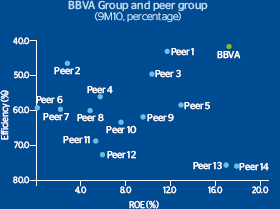
11. and 12. In summary, a very sound Group.
11. ROE and efficiency
12. Geographic diversification of revenues