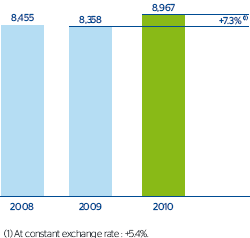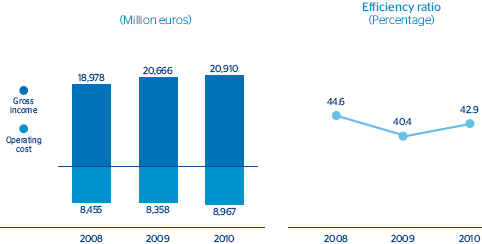
Operating costs for the year were €8,967m and grew 7.3% year-on-year. By types, the largest increases continue to be in administrative expenses. First, as commented in previous quarterly reports, this item includes the increase in rental costs following the sale and leaseback of properties in Spain in the third quarter of 2009 and 2010. It is also important to note that after the conclusion of the Transformation Plan implemented by the Group in previous years, a major investment program is being carried out that mainly affects the franchises operating in emerging countries. They have increased costs year-on-year by 14.4%, compared with a rate of 2.5% in developed countries. Some of its actions include the implementation of various growth plans in all business areas, by improving the information systems, renewing and extending the number of ATMs, applying the BBVA brand’s new positioning and boosting its reputation, through its sponsorship in the Liga BBVA in Spain and the U.S. NBA basketball league.
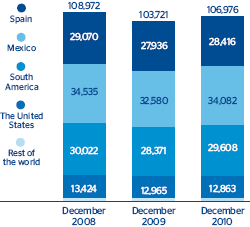
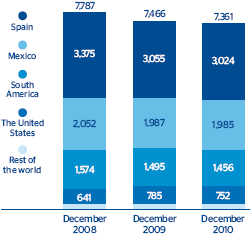
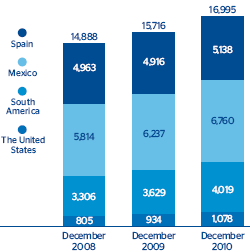
This investment process is accompanied by a gradual increase of the Group’s workforce in almost all of its areas. Thus, as of 31-Dec-2010, BBVA had 106,976 employees, up 3.1% on the previous year. In terms of its distribution network, it now has 1,279 more ATMs than in 31-Dec-2009. Furthermore, the number of offices continues to fall, but at a lower rate than in previous years, as BBVA anticipated the sector’s current trend with its aforementioned Transformation Plan. As of 31-Dec-2010 there were 105 branches fewer than at the close of 2009.
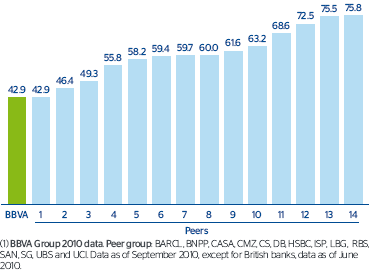
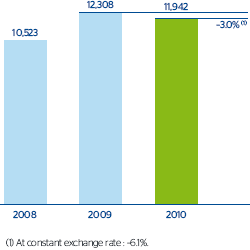
As a result of this course of revenues and expenses, the efficiency ratio is at 42.9%, and BBVA maintains its position as one of the most efficient entities within its reference group. Consequently, the accumulated operating income reached €11,942m, marking a slight 3.0% fall on the previous year.