Logotype

Earnings

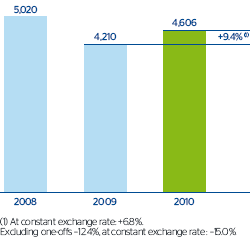
In 2010 BBVA generated a net attributable profit of €4,606m, an increase of 9.4% on the figure for 2009.

The following are earnings highlights for the year:

  • Elevated capacity for generating revenues, as reflected by the accumulated gross income, the highest in BBVA’s history, of €20,910m. This is especially relevant considering the still complex economic backdrop of the year.
  • Increase of diversification, in geographic, business and segment terms, which makes the earnings depend on multiple economies, currencies, sectors and risk factors. In terms of geography, today 58.1% of the Bank’s gross income comes from the Americas and Asia, where BBVA operates through leading franchises that compensate the lesser contribution of Spain. In terms of business, the weight of earnings from units without liquidity or credit risks, such as those managing mutual funds and pensions or insurance, are relevant, as they contribute stability to earnings of the banking business, as they are more cyclical. Furthermore, the Group has specialized units in the different segments of individual customers, SMEs, national and multinational corporations, governments and administrations and financial institutions. This diversity is managed through transversal responsibilities of the geographic areas and businesses.
  • Launch of an ambitious investment plan with the objective of initiating a new path of growth in each of the markets in which BBVA operates. The above has impacted the course of operating expenses (up 7.3% year-on-year, but up 5.4% at constant exchange rates).
  • Positive progress of provisions. After the anticipatory provisions made in the fourth quarter of 2009, the impairment losses on financial assets in 2010 fell by 13.8% as a result of BBVA’s superior risk management. It is also worth noting that the NPA ratio and the coverage ratio improved over the year to 4.1% and 62%, respectively (from 4.3% and 57% at the close of December 2009).
  • General appreciation in currencies with the biggest impact on the Group’s earnings. The exceptions are the Venezuelan bolivar, which devalued in January, and the Argentinean peso, which depreciated slightly over the last twelve months in terms of average exchange rates. In all, the effect of the exchange rates on the year-on-year comparison of the Group’s income statements and balance sheet is positive.

BBVA’s profitability compares favorably with standards in the sector. The Group maintains an outstanding position in terms of average total assets (ATA) with respect to the main items on the income statement. Thus the net interest income over ATA stands at 2.38%, which though below the figure in 2009 is above the 2.26% in 2008. The main causes of this development, apart from the growth of 2.9% in ATA (mainly due to the general appreciation of exchange rates), are the restriction of the net interest income caused by the rise in interest rates, more expensive wholesale funds, and the steady change in the composition of the portfolio, as explained below. However, the greater contribution of net trading income (NTI) and the other gains/losses items has reduced the gap between 2010 and 2009 in terms of gross income over ATA (3.74% in 2010 compared with 3.81% in 2009). Increased lending over the year has reduced the operating income over ATA by 13 basis points to 2.14% (also above the 2008 figure). Finally, the positive trend in loan-loss provisions and provisions (net) and other gains/losses explains why ROA stood at 0.89% (0.85% in 2009).

Consolidated income statement

(Million euros)

Download

  2010 D% D% at constant
exchange rates
2009 2008
NET INTEREST INCOME 13,320 (4.0) (5.3) 13,882 11,686
Net fees and commissions 4,537 2.4 (0.6) 4,430 4,527
Net trading income 1,894 22.7 15.0 1,544 1,558
Dividend income 529 19.3 18.7 443 447
Income by the equity method 335 180.1 180.0 120 293
Other operating income and expenses 295 19.2 (23.7) 248 466
GROSS INCOME 20,910 1.2 (1.5) 20,666 18,978
Operating costs (8,967) 7.3 5.4 (8,358) (8,455)
Personnel expenses (4,814) 3.5 1.9 (4,651) (4,716)
General and administrative expenses (3,392) 12.7 10.4 (3,011) (3,040)
Depreciation and amortization (761) 9.2 7.8 (697) (699)
OPERATING INCOME 11,942 (3.0) (6.1) 12,308 10,523
Impairment on financial assets (net) (4,718) (13.8) (17.9) (5,473) (2,940)
Provisions (net) (482) 5.4 4.4 (458) (1,431)
Other gains (losses) (320) (50.1) (54.4) (641) 775
INCOME BEFORE TAX 6,422 12.0 10.6 5,736 6,926
Income tax (1,427) 25.1 23.7 (1,141) (1,541)
NET INCOME 4,995 8.7 7.3 4,595 5,385
Non-controlling interests (389) 1.1 14.0 (385) (366)
NET ATTRIBUTABLE PROFIT 4,606 9.4 6.8 4,210 5,020
Net one-offs (1) - n.m. n.m. (1,050) (395)
NET ATTRIBUTABLE PROFIT (excluding one-offs) 4,606 (12.4) (15.0) 5,260 5,414
Basic earnings per share (euros) (2) 1.17 8.3   1.08 1.31
Basic earnings per share excluding one-offs (euros) (2) 1.17 (13.3)   1.35 1.41
(1) In the third quarter, both for 2009 and 2010, includes capital gains from the sale-and-leaseback of retail branches which have been allocated to generic provisions for NPA, with no effect on net attributable profit. And in the fourth quarter of 2009, there was an extraordinary provision and a charge for goodwill impairment in the United States. In 2008, capital gains from Bradesco in the first quarter, provisions for non-recurrent early retirements in the second and fourth quarters and provision for the loss originated by the Madoff fraud in the fourth quarter. (2) Earnings per share for periods prior to the share capital increase have been adjusted to the said capital increase as per IAS 33.

Consolidated income statement: quarterly evolution

(Million euros)

Download

  2010 2009
  4Q 3Q 2Q 1Q 4Q 3Q 2Q 1Q
NET INTEREST INCOME 3,138 3,245 3,551 3,386 3,589 3,434 3,586 3,272
Net fees and commissions 1,135 1,130 1,166 1,106 1,163 1,086 1,102 1,079
Net trading income 252 519 490 633 420 325 435 364
Dividend income 227 45 231 25 153 42 207 41
Income by the equity method 124 60 94 57 114 (21) 22 4
Other operating income and expenses 70 85 47 93 (149) 128 140 128
GROSS INCOME 4,946 5,084 5,579 5,301 5,290 4,995 5,492 4,889
Operating costs (2,325) (2,262) (2,262) (2,118) (2,254) (2,017) (2,018) (2,070)
Personnel expenses (1,240) (1,211) (1,215) (1,149) (1,233) (1,126) (1,130) (1,161)
General and administrative expenses (887) (855) (855) (796) (852) (716) (710) (733)
Depreciation and amortization (199) (197) (192) (174) (169) (174) (178) (175)
OPERATING INCOME 2,621 2,821 3,317 3,183 3,036 2,979 3,474 2,819
Impairment on financial assets (net) (1,112) (1,187) (1,341) (1,078) (1,787) (1,741) (1,029) (916)
Provisions (net) (75) (138) (99) (170) (224) (82) (48) (104)
Other gains (losses) (273) 113 (88) (72) (1,240) 791 (228) 36
INCOME BEFORE TAX 1,162 1,609 1,789 1,862 (214) 1,947 2,168 1,834
Income tax (127) (359) (431) (510) 277 (457) (480) (480)
NET INCOME 1,034 1,250 1,358 1,352 63 1,490 1,688 1,354
Non-controlling interests (96) (110) (70) (113) (31) (110) (127) (116)
NET ATTRIBUTABLE PROFIT 939 1,140 1,287 1,240 31 1,380 1,561 1,238
Net one-offs (1) - - - - (1,050) - - -
NET ATTRIBUTABLE PROFIT (excluding one-offs) 939 1,140 1,287 1,240 1,081 1,380 1,561 1,238
EARNINGS PER SHARE                
Basic earnings per share (euros) (2) 0.23 0.29 0.32 0.31 0.01 0.36 0.40 0.33
Basic earnings per share excluding one-offs (euros) (2) 0.23 0.29 0.32 0.31 0.27 0.36 0.40 0.33
(1) In the third quarter, both for 2009 and 2010, includes capital gains from the sale-and-leaseback of retail branches which have been allocated to generic provisions for NPA, with no effect on net attributable profit. And in the fourth quarter of 2009, there was an extraordinary provision and a charge for goodwill impairment in the United States. (2) Earnings per share for periods prior to the share capital increase have been adjusted to the said capital increase as per IAS 33.

Consolidated income statement: percentage of ATA

Download

  2010 2009 2008
NET INTEREST INCOME 2.38 2.56 2.26
Net fees and commissions 0.81 0.82 0.87
Net trading income 0.34 0.28 0.30
Other operating income and expenses 0.21 0.15 0.23
GROSS INCOME 3.74 3.81 3.66
Operating costs (1.60) (1.54) (1.63)
Personnel expenses (0.86) (0.86) (0.91)
General and administrative expenses (0.61) (0.55) (0.59)
Depreciation and amortization (0.14) (0.13) (0.13)
OPERATING INCOME 2.14 2.27 2.03
Impairment on financial assets (net) (0.84) (1.01) (0.57)
Provisions (net) and other gains (losses) (0.14) (0.20) (0.13)
INCOME BEFORE TAX 1.15 1.06 1.34
Income tax (0.26) (0.21) (0.30)
NET INCOME (ROA) 0.89 0.85 1.04
NET INCOME (excluding one-offs)
(ROA excluding one-offs)
0.89 1.04 1.12
Minority interests (0.07) (0.07) (0.07)
NET ATTRIBUTABLE PROFIT 0.82 0.78 0.97
NET ATTRIBUTABLE PROFIT (excluding one-offs) 0.82 0.97 1.05
MEMORANDUM ITEM:      
Average total assets (million euros) 558,808 542,969 517,856

1: Net attributable profit

(Million euros)

Tools