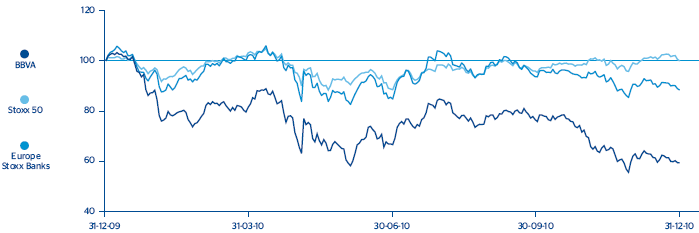
The banking sector has been penalized compared with the main stock market indices, particularly in Europe.
Against the background of a global economic recovery in 2010, stock markets around the world have performed variably, in part reflecting the different economic performance in different regions. Thus, the S&P 500 index in the United States was up 12.8%, the Stoxx 50 in Europe closed the year at the same level as at the end of 2009 (+0.04%), the FTSE in the United Kingdom was up 10.9%, and in Spain the Ibex 35 was down 17.4%.
Uncertainty about the future of some economies in the Eurozone and concerns regarding capital and liquidity levels of banking institutions have been key elements in this behavior. However, in the second half of the year, two factors have mitigated falls in the stock markets in the banking sector. First, the publication of the stress tests of European banks, which were favorably accepted due to their implicit exercise in transparency, particularly in the case of Spain. Second, the confirmation of the delay in the possible end of the injection of liquidity by the European Central Bank (ECB). However, the aggravation of problems in some European countries, particularly Ireland, revived tensions in the markets towards the end of the year.
Thus, the Stoxx Banks and Euro-Stoxx Banks indices in Europe fell by 11.6% and 26.9% respectively, while the FTSE Banks index (United Kingdom) remained practically flat (–0.1%). In the United States, the S&P Financials Index and the S&P Regional Banks index were up 10.8% and 27.4% respectively.
The BBVA earnings figures presented over 2010 have, in general, been favorably received by analysts. Particular value has beenplaced on the confirmation of the Group’s improvement in asset quality, both in Spain and in Mexico and South America, as well as the recovery of business activity and earnings in Latin America.
Analysts have also positively valued the announcement of the acquisition of 24.9% of the Turkish bank Garanti. The main highlighted elements were the quality of the Turkish franchise and the future growth potential both of the country and the bank. The share capital increase undertaken has been well received by the market, as it was backed by 99.9% of the Bank’s shareholders existing prior to the operation. The issue was over-subscribed by over a factor of four. The main highlights of this operation are the Group’s improvement in solvency ratios and the ability of BBVA to anticipate, taking the lead in possible future capital increases by other banks before the implementation of Basel III.
BBVA is trading at a very attractive discount as compared to the sector.
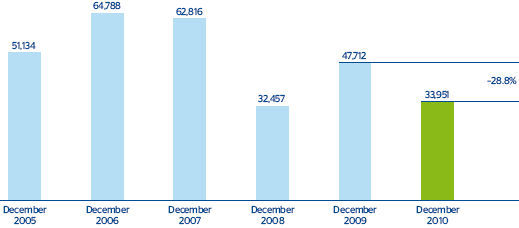
BBVA shares in 2010 have been penalized basically by investors’ concerns about Spain’s macroeconomic situation. In the first half of the year, the share price fell by 32.3%. However, the publication of the stress tests for European banks confirmed the financial strength of the BBVA Group. In the third quarter of the year, BBVA gained 15.0% in its share price and outperformed the Ibex 35. Also, market tension in the fourth quarter had a negative influence on the final price of the shares. Overall, the share price varied between €7.00 and €13.27, closing at €7.56 per share on 31-Dec-2010, giving a market capitalization of €33,951m. The price/earnings ratio was 7.4, compared with 11.3 in December 2009 (both figures were calculated using the price and earnings at yearend). Against this backdrop, BBVA continues to have an attractive valuation compared to the sector.
The tangible book value per share, calculated by dividing the share capital net of goodwill by the number of shares, and taking into account the capital increase undertaken in November 2010, was €6.27, 6.3% up on the figure of €5.90 on December 31, 2009. The price/tangible book value is 1.2, compared with 2.2 on 31-Dec-2009. Earnings per share (EPS) in 2010 stood at €1.17, with an annual variation that is practically the same as the net attributable profit.
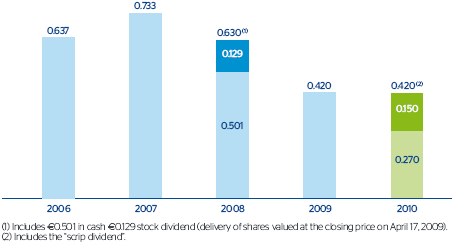
BBVA will maintain its shareholder remuneration at €0.42 per share, replacing the traditional final dividend with the “scrip dividend”. Under this system, three interim dividends have been paid on 2010 earnings for a gross amount of €0.09 per share each.
BBVA continues to offer an attractive and differentiated remuneration.
In addition, it will propose to the Annual General Meeting the “scrip dividend”, which allows shareholders to choose how they receive their remuneration: in newly issued shares, through a share capital increase, or in cash and selling the rights assigned in that capital increase. In all, the total shareholder remuneration will maintain the same level as the previous year, in an environment in which many banks are reviewing their remuneration policy. This dividend results in a yield per share of 5.6%, one of the most attractive in the sector. In addition, it is notable that BBVA not only offers an attractive and differentiated shareholder remuneration, but also gives shareholders a variety of exclusive products and services in very advantageous conditions.
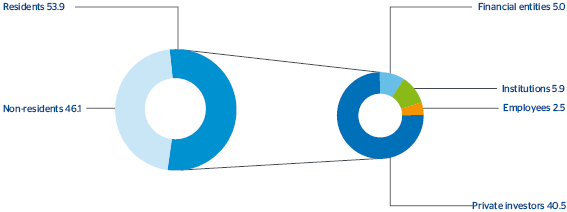
Capital ownership remains very diversified.
Capital ownership remains very diversified. At the close of 2010, the number of BBVA shareholders stood at 952,618, compared with 884,373 on 31-Dec-2009, a 7.7% increase. The only significant individual holding that BBVA is aware of is that of the company Inveravante Inversiones Universales, which as of December 31, 2010 held 5.07% of the share capital. It is worth highlighting that in 2010 shareholder dispersion was maintained, as of December 92.7% held fewer than 4,500 shares (compared with 93.8% as of December 31, 2009), representing 12.6% of the share capital (compared with 12.5% as of December 31, 2009) and an average investment per shareholder of 4,714 shares (4,238 in 2009).
A total of 53.9% of the share capital belongs to investors residing in Spain. In terms of type of shareholder, 40.5% of the share capital belongs to private investors, 2.5% to employees and the remaining 10.9% to institutional investors. There is a high percentage of non-resident shareholders, who own 46.1% of the share capital, which once again reflects the confidence in and recognition of the BBVA name in the current difficult environment.
As in 2009, the shares are traded on the continuous market in Spain, on the New York Stock Exchange (as ADSs represented by ADRs) and also on the London and Mexico stock markets.
BBVA shares continue to have a notably high level of liquidity. They have traded on each of the 256 days in the stock market year of 2010. A total of 17,459 million shares were traded on the stock exchange in this period, 388.8% of the share capital. Thus the daily average volume of traded shares was 68 million, 1.5% of the share capital and an effective daily average of €655m.
Finally, BBVA shares are included in the key Ibex 35 and Euro Stoxx 50 indices, with a weighting of 9,5% in the former and 2,2% in the latter, as well as in several banking industry indices, most notably the Stoxx Banks, with a weighting of 10,0%. BBVA is also present in the market’s leading sustainability indices, such as DowJones and MSCI Sustainability Indexes.