The Wholesale Banking & Asset Management (WB&AM) area handles the Group’s wholesale businesses and asset management in all the geographical areas where it operates. For the purposes of this financial report, the business and revenues of the units in the Americas are recorded in their respective areas (Mexico, South America and the United States). WB&AM is organized in three main business units:
Corporate and Investment Banking (C&IB), Global Markets (GM) and Asset Management (AM). It also includes the Industrial and Real Estate Holdings unit and the Group’s holdings in the CITIC financial group.
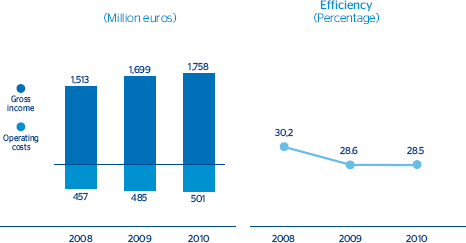
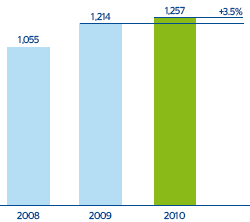
The area once more showed a clear customer focus and a high level of recurrence and quality in its revenues in 2010, despite the economic upheaval in the markets. Accumulated gross income amounted to €1,758m, 3.4% up on 2009, supported by recurring revenue (net interest income and net fees) from C&IB and the increased contribution from the CITIC group. Operating costs ended the year 3.3% up on the figure for 2009, mainly the result of systems investments and the various growth plans implemented in all the geographical areas. Operating income increased by 3.5% on 2009 to €1,257m.
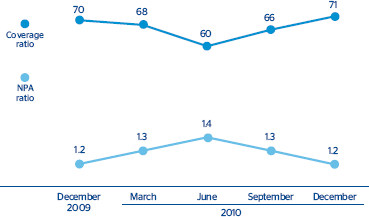
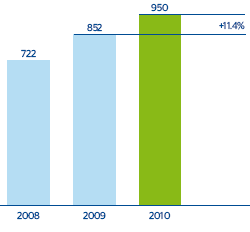
WB&AM continues with an excellent level of asset quality, with a low non-performing asset attributable profit for the year was €950m (€852m in 2009).
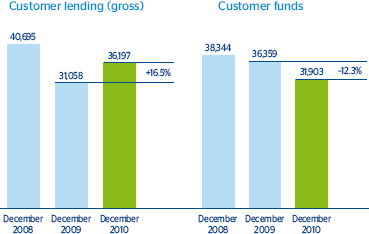
In terms of business activity, the area’s gross lending as of 31-Dec-2010 was up 16.5% to €36,197m. This is the result of a greater volume of temporary asset acquisitions in Global Markets, as in C&IB the trend continues to be contained, with a year-on-year fall in gross customer lending of 2.7%. This is because improving asset quality means focusing on customers with a greater loyalty, profitability and credit quality. Customer funds (deposits, mutual funds and pension funds) closed the year at €31,903m, 12.3% below the figure for 2009.
The business and earnings of WB&AM units in the Americas are recorded in the United States, Mexico and South America. Adding these to the above results, the area’s combined contributions to the Group are those shown in the table below.
Income statement
(Million euros)
Download
| |
Wholesale Banking & Asset Management |
Units: |
| |
|
Corporate and Investment Banking |
Global Markets |
| |
2010 |
D% |
2009 |
2008 |
2010 |
D% |
2009 |
2010 |
D% |
2009 |
| NET INTEREST INCOME |
831 |
(15.4) |
982 |
618 |
507 |
12.1 |
452 |
382 |
(34.0) |
579 |
| Net fees and commissions |
492 |
6.8 |
461 |
375 |
351 |
15.7 |
304 |
39 |
(15.8) |
47 |
| Net trading income |
(66) |
13.1 |
(59) |
114 |
58 |
25.8 |
46 |
(162) |
(2.1) |
(165) |
| Other income/expenses |
500 |
59.2 |
314 |
406 |
- |
- |
- |
156 |
17.5 |
133 |
| GROSS INCOME |
1,758 |
3.4 |
1,699 |
1,513 |
916 |
14.2 |
802 |
415 |
(30.0) |
593 |
| Operating costs |
(501) |
3.3 |
(485) |
(457) |
(151) |
10.4 |
(137) |
(213) |
(0.4) |
(214) |
| Personnel expenses |
(330) |
3.3 |
(319) |
(279) |
(90) |
11.2 |
(81) |
(116) |
(3.0) |
(119) |
| General and administrative expenses |
(162) |
3.8 |
(156) |
(171) |
(59) |
9.7 |
(54) |
(96) |
2.9 |
(93) |
| Depreciation and amortization |
(9) |
(7.6) |
(10) |
(8) |
(1) |
(6.8) |
(1) |
(1) |
(6.2) |
(2) |
| OPERATING INCOME |
1,257 |
3.5 |
1,214 |
1,055 |
765 |
15.0 |
665 |
202 |
(46.6) |
379 |
| Impairment on financial assets (net) |
(116) |
92.9 |
(60) |
(171) |
(49) |
(28.5) |
(69) |
(31) |
n.m. |
3 |
| Provisions (net) and other gains (losses) |
2 |
n.m. |
(4) |
4 |
2 |
n.m. |
(2) |
- |
- |
- |
| INCOME BEFORE TAX |
1,143 |
(0.6) |
1,150 |
888 |
718 |
20.8 |
595 |
171 |
(55.2) |
382 |
| Income tax |
(192) |
(34.8) |
(294) |
(160) |
(212) |
21.9 |
(174) |
(29) |
(69.7) |
(97) |
| NET INCOME |
951 |
11.2 |
856 |
728 |
506 |
20.4 |
421 |
142 |
(50.3) |
285 |
| Non-controlling interests |
(2) |
(53.2) |
(3) |
(6) |
- |
- |
- |
- |
n.m. |
(2) |
| NET ATTRIBUTABLE PROFIT |
950 |
11.4 |
852 |
722 |
506 |
20.4 |
421 |
142 |
(50.0) |
283 |
Balance sheet
(Million euros)
Download
| |
31-12-10 |
D% |
31-12-09 |
31-12-08 |
31-12-10 |
D% |
31-12-09 |
31-12-10 |
D% |
31-12-09 |
| Cash and balances with central banks |
1,768 |
189.9 |
610 |
1,488 |
153 |
124.7 |
68 |
1,607 |
200.4 |
535 |
| Financial assets |
55,729 |
(8.7) |
61,024 |
64,113 |
405 |
(3.2) |
418 |
52,041 |
(10.9) |
58,441 |
| Loans and receivables |
48,346 |
13.2 |
42,695 |
56,871 |
30,607 |
(0.7) |
30,808 |
16,700 |
57.6 |
10,598 |
| . Loans and advances to customers |
35,754 |
16.5 |
30,684 |
39,846 |
28,490 |
(2.8) |
29,323 |
7,026 |
n.m. |
1,222 |
| . Loans and advances to credit institutions and other |
12,591 |
4.8 |
12,011 |
17,024 |
2,118 |
42.6 |
1,485 |
9,674 |
3.2 |
9,376 |
| Inter-area positions |
12,644 |
n.m. |
- |
- |
- |
- |
- |
28,676 |
53.2 |
18,714 |
| Tangible assets |
35 |
8.9 |
32 |
39 |
1 |
47.3 |
1 |
3 |
(9.0) |
3 |
| Other assets |
3,000 |
36.3 |
2,202 |
1,548 |
25 |
(13.2) |
29 |
1,208 |
3.7 |
1,165 |
| TOTAL ASSETS / LIABILITIES AND EQUITY |
121,522 |
14.0 |
106,563 |
124,058 |
31,191 |
(0.4) |
31,324 |
100,235 |
12.1 |
89,455 |
| Deposits from central banks and credit institutions |
31,575 |
0.6 |
31,399 |
22,292 |
3,512 |
n.m. |
573 |
27,815 |
(9.1) |
30,615 |
| Deposits from customers |
43,819 |
25.7 |
34,864 |
36,089 |
10,608 |
3.7 |
10,233 |
33,210 |
34.8 |
24,630 |
| Debt certificates |
1 |
n.m. |
- |
191 |
1 |
n.m. |
- |
- |
- |
- |
| Subordinated liabilities |
2,322 |
18.0 |
1,967 |
2,150 |
837 |
0.1 |
836 |
565 |
19.2 |
475 |
| Inter-area positions |
- |
n.m. |
183 |
16,918 |
13,321 |
(20.7) |
16,790 |
- |
- |
- |
| Financial liabilities held for trading |
34,812 |
13.0 |
30,799 |
38,303 |
- |
- |
- |
34,811 |
13.0 |
30,799 |
| Other liabilities |
5,113 |
36.8 |
3,738 |
4,534 |
1,664 |
18.4 |
1,405 |
2,833 |
35.0 |
2,099 |
| Economic capital allocated |
3,879 |
7.4 |
3,613 |
3,581 |
1,247 |
(16.0) |
1,486 |
999 |
19.3 |
838 |
Relevant business indicators
(Million euros and percentages)
Download
|
Wholesale Banking & Asset Management |
| |
31-12-10 |
D% |
31-12-09 |
31-12-08 |
| Total lending to customers (gross) |
36,197 |
16.5 |
31,058 |
40,695 |
| Customer deposits |
27,632 |
(15.7) |
32,788 |
37,356 |
| . Deposits |
21,118 |
(16.3) |
25,220 |
27,520 |
| . Assets sold under repurchase agreements |
6,515 |
(13.9) |
7,568 |
9,837 |
| Off-balance sheet funds |
10,785 |
(3.2) |
11,139 |
10,824 |
| . Mutual funds |
3,576 |
(8.6) |
3,914 |
4,014 |
| . Pension funds |
7,209 |
(0.2) |
7,224 |
6,810 |
| Efficiency ratio (%) |
28.5 |
|
28.6 |
30.2 |
| NPA ratio (%) |
1.2 |
|
1.2 |
0.2 |
| Coverage ratio (%) |
71 |
|
70 |
797 |
Wholesale Banking & Asset Management including the Americas
(Million euros)
Download
|
|
|
|
|
| Income statement |
2010 |
D% |
2009 |
2008 |
| Gross income |
3,029 |
(0.8) |
3,052 |
2,626 |
| Operating costs |
(800) |
7.7 |
(743) |
(708) |
| Operating income |
2,229 |
(3.5) |
2,309 |
1,918 |
| Income before tax |
2,033 |
(5.2) |
2,144 |
1,679 |
| Net attributable profit |
1,486 |
3.6 |
1,434 |
1,169 |
| Balance sheet |
31-12-10 |
D% |
31-12-09 |
31-12-08 |
| Total lending to customers (gross) |
54,669 |
13.8 |
48,054 |
61,649 |
| Customer funds on balance sheet |
48,532 |
(32.8) |
72,208 |
75,326 |
| Other customer funds |
10,294 |
(4.9) |
10,826 |
20,257 |
| Total customer funds |
58,825 |
(29.2) |
83,033 |
95,584 |
| Economic capital allocated |
4,320 |
5.1 |
4,111 |
4,532 |
44: Wholesale Banking & Asset Management . Efficiency
45: Wholesale Banking & Asset Management. Operating income
(Million euros)
46: Wholesale Banking & Asset Management . NPA and coverage ratio
(Percentage)
47: Wholesale Banking & Asset Management. Net attributable profit
(Million euros)
48: Wholesale Banking & Asset Management. Key activity data
(Million euros)

