(Consolidated figures)
| 31-12-10 | D% | 31-12-09 | 31-12-08 | |
|---|---|---|---|---|
| BALANCE SHEET (million euros) | ||||
| Total assets | 552,738 | 3.3 | 535,065 | 542,650 |
| Total lending (gross) | 348,253 | 4.8 | 332,162 | 342,682 |
| Customer funds on balance sheet | 378,388 | 1.7 | 371,999 | 376,380 |
| Other customer funds | 147,572 | 7.6 | 137,105 | 119,028 |
| Total customer funds | 525,960 | 3.3 | 509,104 | 495,408 |
| Total equity | 37,475 | 21.8 | 30,763 | 26,705 |
| Stockholders' funds | 36,689 | 25.0 | 29,362 | 26,586 |
| INCOME STATEMENT (million euros) | ||||
| Net interest income | 13,320 | (4.0) | 13,882 | 11,686 |
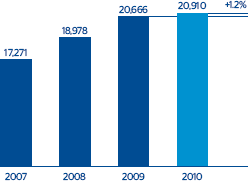
| Gross income | 20,910 | 1.2 | 20,666 | 18,978 |
| Operating income | 11,942 | (3.0) | 12,308 | 10,523 |
| Income before tax | 6,422 | 12.0 | 5,736 | 6,926 |
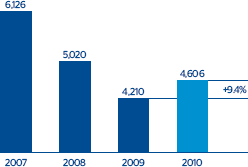
| Net attributable profit | 4,606 | 9.4 | 4,210 | 5,020 |
| Net attributable profit excluding one-offs (1) | 4,606 | (12.4) | 5,260 | 5,414 |
| DATA PER SHARE AND SHARE PERFORMANCE RATIOS | ||||
| Share price (euros) | 7.56 | (40.6) | 12.73 | 8.66 |
| Market capitalization (million euros) | 33,951 | (28.8) | 47,712 | 32,457 |
| Net attributable profit per share (euros) (2) | 1.17 | 8.3 | 1.08 | 1.31 |
| Net attributable profit per share excluding one-offs (euros) (1 - 2) | 1.17 | (13.3) | 1.35 | 1.41 |
| Dividend per share (euros) (3) | 0.42 | - | 0.42 | 0.63 |
| Book value per share (euros) | 8.17 | 4.3 | 7.83 | 7.09 |
| Tangible book value per share (euros) (4) | 6.27 | 6.3 | 5.90 | 4.99 |
| P/BV (Price/book value; times) | 0.9 |
|
1.6 | 1.2 |
| Price/tangible book value (times) (4) | 1.2 |
|
2.2 | 1.7 |
| PER (Price/Earnings; times) | 7.4 |
|
11.3 | 6.5 |
| Yield (Dividend/Price; %) (3) | 5.6 |
|
3.3 | 7.3 |
| SIGNIFICANT RATIOS (%) | ||||
| ROE (Net attributable profit/Average equity) | 15.8 |
|
16.0 | 21.5 |
| ROE excluding one-offs (1) | 15.8 |
|
20.0 | 23.2 |
| ROA (Net income/Average total assets) | 0.89 |
|
0.85 | 1.04 |
| ROA excluding one-offs (1) | 0.89 |
|
1.04 | 1.12 |
| RORWA (Net income/Average risk-weighted assets) | 1.64 |
|
1.56 | 1.94 |
| RORWA excluding one-offs (1) | 1.64 |
|
1.92 | 2.08 |
| Efficiency ratio | 42.9 |
|
40.4 | 44.6 |
| Risk premium | 1.33 |
|
1.54 | 0.83 |
| NPA ratio | 4.1 |
|
4.3 | 2.3 |
| NPA coverage ratio | 62 |
|
57 | 92 |
| CAPITAL ADEQUACY RATIOS (%) | ||||
| BIS Ratio | 13.7 |
|
13.6 | 12.2 |
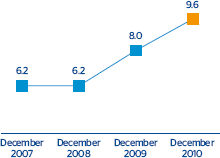
| Core capital | 9.6 |
|
8.0 | 6.2 |
| Tier I | 10.5 |
|
9.4 | 7.9 |
| OTHER INFORMATION | ||||
| Number of shares (millions) | 4,491 |
|
3,748 | 3,748 |
| Number of shareholders | 952,618 |
|
884,373 | 903,897 |
| Number of employees | 106,976 |
|
103,721 | 108,972 |
| Number of branches | 7,361 |
|
7,466 | 7,787 |
| Number of ATMs | 16,995 |
|
15,716 | 14,888 |


