

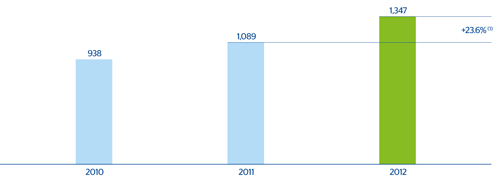
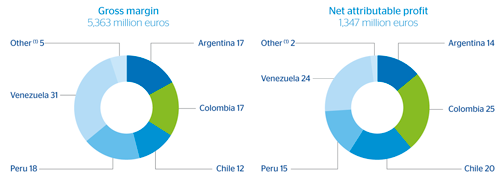
South America closed the year with a significant increase in earnings of 23.6%, reaching a net attributable profit of €1,347m.
43 South America. Net attributable profit
(Million euros at constant exchange rates)
Recurring revenues have continued to grow thanks to growing activity and good price management, which is reflected in higher spreads. As a result, net interest income closed the year at €4,291m, up 25.6% on the figure posted in 2011. Fees and commissions were up 18.3% to €910m.
NTI is down 14.9% on the previous year, since 2011 earnings included the effect of the revaluation of USD positions of BBVA Provincial in Venezuela. The other income/expenses heading amounts to a negative €281m, despite the favorable performance of the insurance business in the region, due to the negative effect of hyperinflation in Venezuela and the greater contribution of the deposit guarantee funds in the countries where the Bank operates.
As a result of the above, the cumulative gross income for the area increased by 21.6% year-on-year to €5,363m.
Operating costs have remained high and stand at €2,328m, up 15.4% on the figure for the same period in the previous year. This increase is the result of the high inflation recorded in the area and the investments made to implement the expansion and technological transformation plans. The investment plan seeks to make the most of the growth opportunities in the region, due both to buoyant activity and the possibilities for bank penetration. It also seeks to improve the quality of customer service, based on the corporate customer-centric policy.
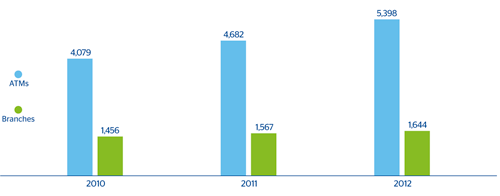
44 South America. Evolution of branch network and ATMs
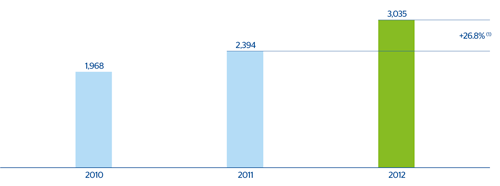
This performance of revenues and expenses has resulted in an improvement of the efficiency ratio in the area, which closes the year at 43.4% (46.2% the previous year), and a 26.8% increase in operating income to €3,035m.
45 South America. Efficiency
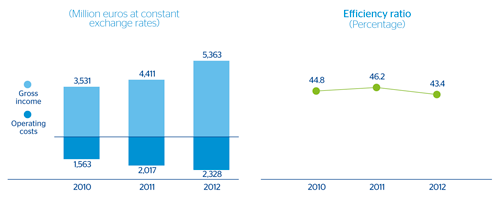
46 South America. Operating income
(Million euros at constant exchange rates)
Finally, impairment losses on financial assets are up 21.6%, in line with increased activity, and stand at €593m. As a result, the risk premium stands at 1.64% (1.85% as of 31-12-2012).
To sum up, strong activity, combined with good price management, has resulted in notable growth in the revenue lines. This, together with expenses that include expansion plans (though they are growing slower than revenue), and improved asset quality, has resulted in a 23.6% increase in net attributable profit in the year.
Below are some of the most important aspects of the performance of the various countries and the insurance activity in 2012.
Grupo BBVA. Business share ranking in South America in 2012
 Download Excel
|
|
Loan | Deposit | Pensions |
|---|---|---|---|
| Argentina | 4th | 3rd | - |
| Bolivia | - | - | 1st |
| Chile | 5th | 5th | 1st |
| Colombia | 4th | 4th | 3rd |
| Ecuador | - | - | 1st |
| Panama | 5th | 4th | - |
| Paraguay | 4th | 4th | - |
| Peru | 2nd | 2nd | 3rd |
| Uruguay | 2nd | 3rd | - |
| Venezuela | 3rd | 2nd | - |
47 South America. Breakdown of gross income and net attributable profit by country
(Year 2012. Percentage)
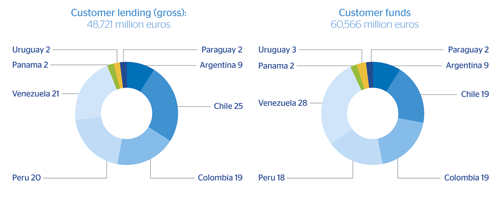
48 South America. Breakdown of gross customer lending and on-balance-sheet customer funds by country
(31-12-12. Percentage)
South America. Financial statements of the main countries. Income statement
(Million euros)
Download Excel
|
|
Argentina | Chile | Colombia | Peru | Venezuela | |||||||||||||||
|---|---|---|---|---|---|---|---|---|---|---|---|---|---|---|---|---|---|---|---|---|
|
|
2012 | Δ% | Δ% (1) | 2011 | 2012 | Δ% | Δ% (1) | 2011 | 2012 | Δ% | Δ% (1) | 2011 | 2012 | Δ% | Δ% (1) | 2011 | 2012 | Δ% | Δ% (1) | 2011 |
| Net interest income | 575 | 42.0 | 44.4 | 405 | 462 | 10.4 | 2.7 | 419 | 684 | 24.5 | 11.8 | 549 | 665 | 28.0 | 13.2 | 520 | 1,720 | 57.4 | 45.3 | 1,093 |
| Net fees and commissions | 229 | 31.4 | 33.6 | 174 | 85 | 0.9 | (6.2) | 84 | 112 | 13.0 | 1.5 | 99 | 177 | 24.1 | 9.8 | 142 | 255 | 48.4 | 37.0 | 172 |
| Net trading income | 60 | (32.3) | (31.2) | 89 | 26 | (16.4) | (22.3) | 32 | 85 | 119.0 | 96.7 | 39 | 128 | 38.6 | 22.6 | 93 | 114 | (46.6) | (50.7) | 214 |
| Other income/expenses | 69 | (2.4) | (0.8) | 71 | 71 | 44.2 | 34.1 | 49 | 8 | n.m. | n.m. | (7) | (13) | 8.2 | (4.3) | (12) | (404) | 13.3 | 4.7 | (357) |
| Gross income | 934 | 26.3 | 28.4 | 739 | 645 | 10.4 | 2.7 | 584 | 889 | 30.7 | 17.4 | 680 | 958 | 28.9 | 14.0 | 743 | 1,685 | 50.2 | 38.7 | 1,121 |
| Operating costs | (492) | 15.8 | 17.8 | (425) | (324) | 16.5 | 8.4 | (278) | (373) | 23.7 | 11.2 | (302) | (316) | 25.9 | 11.3 | (251) | (623) | 38.0 | 27.4 | (452) |
| Personnel expenses | (270) | 12.5 | 14.4 | (240) | (179) | 19.5 | 11.2 | (150) | (167) | 22.4 | 10.0 | (137) | (169) | 25.5 | 11.0 | (135) | (266) | 40.3 | 29.5 | (189) |
| General and administrative expenses | (202) | 19.1 | 21.1 | (169) | (135) | 19.9 | 11.5 | (112) | (175) | 26.7 | 13.8 | (138) | (124) | 25.7 | 11.2 | (99) | (276) | 43.2 | 32.2 | (193) |
| Depreciation and amortization | (20) | 32.0 | 34.2 | (15) | (10) | (36.8) | (41.2) | (16) | (31) | 15.3 | 3.6 | (27) | (22) | 29.1 | 14.1 | (17) | (81) | 17.3 | 8.4 | (69) |
| Operating income | 442 | 40.5 | 42.8 | 315 | 321 | 4.9 | (2.4) | 306 | 516 | 36.2 | 22.3 | 379 | 642 | 30.5 | 15.4 | 492 | 1,061 | 58.5 | 46.3 | 670 |
| Impairment on financial assets (net) | (55) | 48.9 | 51.4 | (37) | (89) | 40.5 | 30.7 | (64) | (113) | 41.5 | 27.1 | (80) | (139) | 71.4 | 51.6 | (81) | (185) | 10.3 | 1.8 | (168) |
| Provisions (net) and other gains (losses) | (15) | n.m. | n.m. | 1 | 7 | n.m. | n.m. | (4) | 10 | (31.9) | (38.8) | 15 | (4) | (31.8) | (39.7) | (6) | (194) | 111.9 | 95.7 | (92) |
| Income before tax | 371 | 33.1 | 35.4 | 279 | 239 | 0.3 | (6.7) | 238 | 413 | 31.5 | 18.1 | 314 | 499 | 23.2 | 8.9 | 405 | 682 | 66.2 | 53.5 | 410 |
| Income tax | (121) | 56.2 | 58.8 | (78) | (37) | (5.7) | (12.3) | (39) | (105) | 39.6 | 25.4 | (75) | (132) | 29.0 | 14.1 | (102) | (87) | 90.7 | 76.0 | (46) |
| Net income from ongoing operations | 250 | 24.3 | 26.3 | 201 | 202 | 1.5 | (5.6) | 199 | 308 | 29.0 | 15.8 | 239 | 367 | 21.2 | 7.2 | 303 | 595 | 63.2 | 50.7 | 364 |
| Net income from discontinued operations | - | - | - | - | 168 | 39.0 | 29.3 | 121 | 36 | 66.0 | 49.1 | 22 | 37 | 119.1 | 93.8 | 17 | - | - | - | - |
| Net income | 250 | 24.3 | 26.3 | 201 | 370 | 15.7 | 7.6 | 320 | 344 | 32.0 | 18.6 | 261 | 404 | 26.4 | 11.8 | 320 | 595 | 63.2 | 50.7 | 364 |
| Non-controlling interests | (59) | 32.8 | 35.0 | (44) | (102) | 6.6 | (0.9) | (96) | (13) | 30.7 | 17.5 | (10) | (209) | 25.6 | 11.1 | (166) | (265) | 62.2 | 49.7 | (163) |
| Net attributable profit | 191 | 21.8 | 23.9 | 157 | 268 | 19.6 | 11.2 | 224 | 331 | 32.1 | 18.7 | 251 | 195 | 27.1 | 12.5 | 154 | 329 | 64.0 | 51.4 | 201 |
Balance sheet
(Million euros)
Download Excel
|
|
Argentina | Chile | Colombia | Peru | Venezuela | |||||||||||||||
|---|---|---|---|---|---|---|---|---|---|---|---|---|---|---|---|---|---|---|---|---|
|
|
31-12-12 | Δ% | Δ% (1) | 31-12-11 | 31-12-12 | Δ% | Δ% (1) | 31-12-11 | 31-12-12 | Δ% | Δ% (1) | 31-12-11 | 31-12-12 | Δ% | Δ% (1) | 31-12-11 | 31-12-12 | Δ% | Δ% (1) | 31-12-11 |
| Cash and balances with central banks | 1,341 | 0.9 | 17.3 | 1,329 | 381 | 8.3 | 1.7 | 352 | 1,537 | 67.8 | 55.7 | 916 | 3,565 | 56.2 | 50.7 | 2,283 | 5,531 | 86.1 | 89.6 | 2,971 |
| Financial assets | 569 | (35.0) | (24.4) | 875 | 2,499 | (14.7) | (19.9) | 2,930 | 2,325 | 17.3 | 8.8 | 1,982 | 998 | 9.6 | 5.8 | 911 | 3,232 | 82.1 | 85.5 | 1,775 |
| Loans and receivables | 4,753 | 3.1 | 20.0 | 4,609 | 12,907 | 21.5 | 14.0 | 10,627 | 9,185 | 23.0 | 14.1 | 7,467 | 9,655 | 13.1 | 9.2 | 8,535 | 11,385 | 42.6 | 45.3 | 7,983 |
| Loans and advances to customers | 4,208 | 5.9 | 23.2 | 3,974 | 11,974 | 24.6 | 17.0 | 9,607 | 8,948 | 22.9 | 14.0 | 7,280 | 9,377 | 14.1 | 10.2 | 8,216 | 9,693 | 43.3 | 46.0 | 6,766 |
| Loans and advances to credit institutions and others | 544 | (14.2) | (0.2) | 635 | 933 | (8.5) | (14.2) | 1,020 | 238 | 26.8 | 17.7 | 187 | 278 | (12.7) | (15.8) | 319 | 1,691 | 39.0 | 41.6 | 1,217 |
| Tangible assets | 109 | (4.9) | 10.6 | 115 | 94 | (26.5) | (31.0) | 128 | 118 | 9.6 | 1.6 | 108 | 203 | 15.8 | 11.8 | 175 | 307 | 34.0 | 36.6 | 229 |
| Other assets | 183 | 14.6 | 33.3 | 160 | 1,199 | 59.3 | 49.5 | 753 | 530 | 74.2 | 61.6 | 304 | 465 | 46.1 | 41.0 | 318 | 379 | 30.8 | 33.3 | 289 |
| Total assets/Liabilities and equity | 6,954 | (1.9) | 14.1 | 7,088 | 17,080 | 15.5 | 8.4 | 14,790 | 13,695 | 27.1 | 17.9 | 10,778 | 14,886 | 21.8 | 17.6 | 12,222 | 20,834 | 57.3 | 60.2 | 13,248 |
| Deposits from central banks and credit institutions | 80 | (54.3) | (46.8) | 174 | 2,654 | 11.0 | 4.2 | 2,391 | 404 | (54.0) | (57.4) | 880 | 2,206 | 73.5 | 67.5 | 1,272 | 223 | 13.2 | 15.4 | 197 |
| Deposits from customers | 5,280 | 1.3 | 17.8 | 5,213 | 7,829 | 11.9 | 5.0 | 6,997 | 10,256 | 40.8 | 30.6 | 7,286 | 9,335 | 9.5 | 5.7 | 8,527 | 17,449 | 63.4 | 66.5 | 10,677 |
| Debt certificates | 78 | 77.0 | 105.9 | 44 | 1,557 | 35.1 | 26.8 | 1,153 | 536 | 13.7 | 5.5 | 471 | 992 | 127.4 | 119.5 | 436 | - | - | - | - |
| Subordinated liabilities | - | - | - | - | 650 | 8.2 | 1.6 | 601 | 157 | 7.7 | (0.0) | 145 | 352 | (0.1) | (3.5) | 352 | - | - | - | - |
| Financial liabilities held for trading | - | - | - | 4 | 766 | (6.1) | (11.9) | 815 | 76 | (29.2) | (34.4) | 108 | 100 | 28.8 | 24.3 | 77 | - | - | - | - |
| Other liabilities | 1,155 | (10.6) | 4.0 | 1,292 | 3,074 | 30.7 | 22.7 | 2,352 | 1,380 | 36.8 | 26.9 | 1,009 | 1,421 | 26.1 | 21.8 | 1,127 | 2,399 | 31.7 | 34.2 | 1,822 |
| Economic capital allocated | 362 | 0.5 | 16.9 | 361 | 550 | 14.3 | 7.3 | 481 | 886 | 0.9 | (6.4) | 878 | 480 | 11.5 | 7.6 | 430 | 763 | 37.9 | 40.5 | 553 |