
2012 Highlights
26
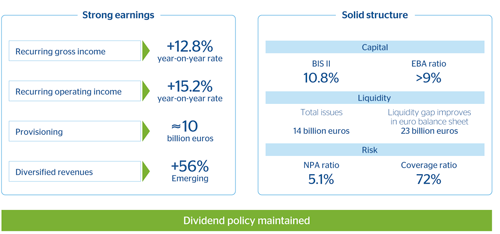
BBVA generates high recurring revenues to absorb the year’s provisioning effort
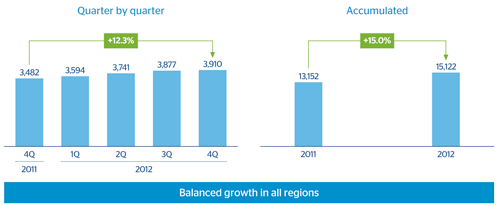
1. Highly positive trend of net interest income during the year...
27 Net interest income
(Million euros)
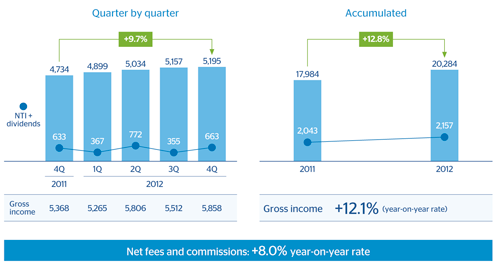
2. …reflected in gross income…
28 Recurring gross income (1)
(Million euros)
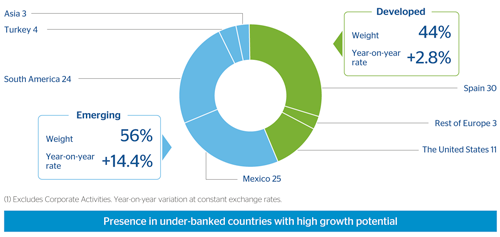
3. …thanks to adequate diversification across emerging and developed markets
29 Gross income breakwodn (1)
(Percentage)
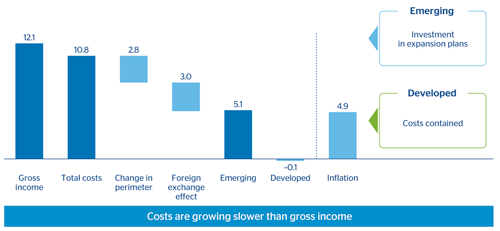
4. This, combined with suitable cost management tailored for the needs of each region…
30 Gross income and operating costs
(Year-on-year rate in percentage)
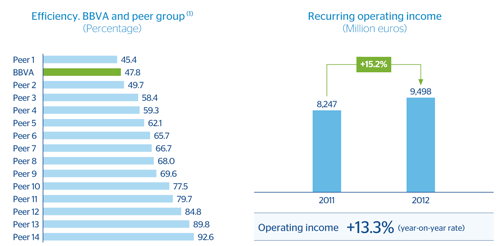
5. …means to remain one of the top banks in efficiency with high recurring operating income…
31 Efficiency and recurring operating income
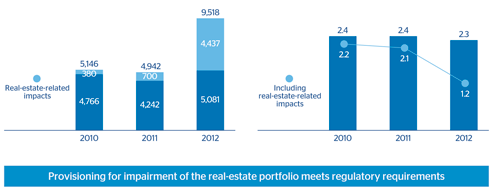
6. …that can support the year’s provisioning effort without any difficulty
32 Loan-loss and real-estate provisioning(Million euros) |
Operating income/loan-loss and real-estate provisioning(Times) |
|---|
7. In summary, a solid income statement
Income statement
(Million euros)
|
|
Accumulated | Year-on-year change 2012-2011 | |
|---|---|---|---|
|
|
2012 | Absolute | Percentage |
| Net interest income | 15,122 | +1,970 | 15.0 |
| Gross income | 22,441 | +2,414 | 12.1 |
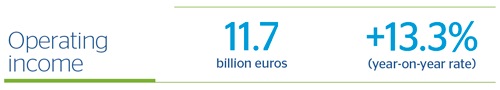
| Operating income | 11,655 | +1,365 | 13.3 |
| Provisions related to real estate in Spain | –4,437 | –3,737 | n.m. |
| Rest of provisions | –5,559 | +585 | –9.5 |
| Income before tax | 1,659 | –1,787 | –51.9 |
| Net attributable profit | 1,676 | –1,328 | –44.2 |
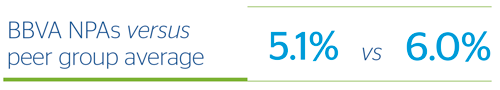
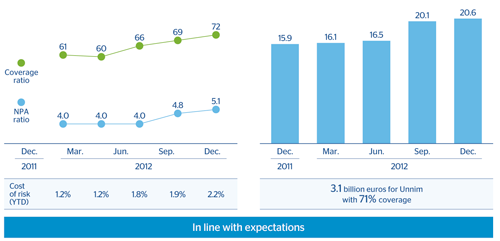
Risk under control
33 NPA and coverage ratios(Percentage) |
NPAs(Billion euros) |
|---|
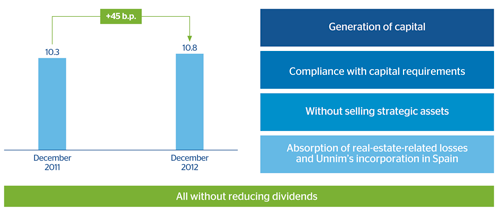
Core capital ratios improved and dividend maintained
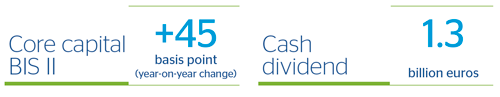
1. Solid position and the ability to generate more
34 Core capital ratio (BIS II)
(Percentage)
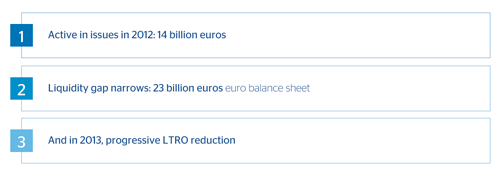
Continuous improvement in funding structure

1. Excellent balance sheet management in a complex enviroment
35
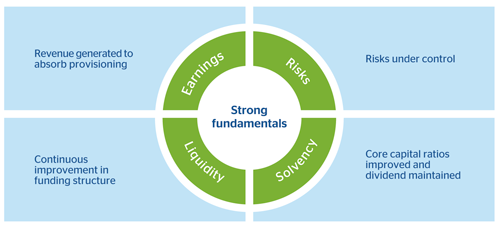
In short, solid fundamentals
36