
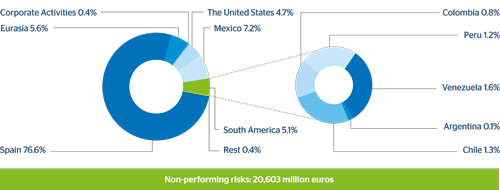
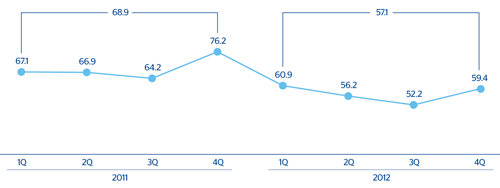
Non-performing risks closed as of 31-12-2012 at €20,603m, a rise of over €4.737m over the year. Part of this increase is basically due to the integration of the Unnim balances. At the close of December Unnim’s NPA figure stood at €3,122m, but with a high coverage ratio. The rest of the increase can be explained by the worsening NPA ratio in Spain, in line with existing forecasts. With respect to changes in non-performing assets, over 2012 there was a higher level of gross additions to NPA and a slightly lower level of recoveries. As a result, the ratio of recoveries over entries to NPA in 2012 was 57.1%. Many of the additions to NPA were subjective in nature.
25 BBVA Group. Non-performing loans. Distribution by business area
(31-12-2012)
The following tables show the changes in the period from January 1 to December 31, 2012 for impaired loans and non-performing contingent liabilities, both for the BBVA Group as a whole and for each business area.
BBVA Group. Variation in non-performing assets
(Million euros)
 Download Excel
|
|
2012 | 2011 | 2010 |
|---|---|---|---|
| Beginning balance | 15,866 | 15,685 | 15,602 |
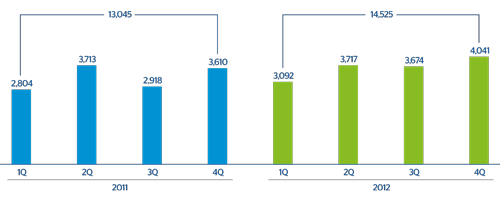
| Entries | 14,525 | 13,045 | 13,207 |
| Recoveries | (8,291) | (8,992) | (9,063) |
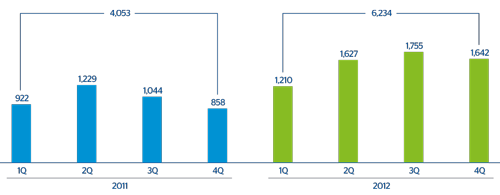
| Net entry | 6,234 | 4,053 | 4,144 |
| Write-offs | (4,395) | (4,093) | (4,307) |
| Exchange differences and others | 2,899 | 221 | 246 |
| Final balance | 20,603 | 15,866 | 15,685 |
BBVA Group. Variation in non-performing assets by business area
(Million euros)
Download Excel
|
|
Spain | Eurasia | Mexico | South America | The United States | |||||
|---|---|---|---|---|---|---|---|---|---|---|
|
|
2012 | 2011 | 2012 | 2011 | 2012 | 2011 | 2012 | 2011 | 2012 | 2011 |
| Beginning balance | 11,176 | 701 | 311 | 311 | 1,275 | 1,181 | 996 | 880 | 1,616 | 1,964 |
| Entries | 3,754 | 594 | 200 | 200 | 1,370 | 1,317 | 543 | 363 | (84) | 113 |
| Write-offs | (2,249) | (137) | (46) | (46) | (1,212) | (1,126) | (437) | (263) | (346) | (496) |
| Exchange differences and others | 3,098 | 3 | 236 | 236 | 56 | (97) | 20 | 16 | (208) | 35 |
| Final balance | 15,778 | 1,160 | 701 | 701 | 1,488 | 1,275 | 1,121 | 996 | 978 | 1,616 |
26 BBVA Group. NPA entries
(Million euros)
27 BBVA Group. Net NPA entries
(Million euros)
28 BBVA Group. NPA recoveries
(Percentage)
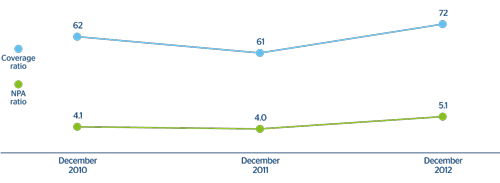
The Group’s NPA ratio at the end of December 2012 stood at 5.1%, up 110 basis points over the year. Of this rise, 56 basis points are the result of the aforementioned integration of Unnim. The rest is mainly the result of the deterioration of the economic situation in Spain, combined with the financial deleveraging process underway, as a result of which the ratio in the area amounted to 6.9% at the close of December 2012. In Mexico, the NPA ratio was stable over the year and closed at 3.8%. In Eurasia, it rose to 2.8%. In the United States it fell significantly once again to 2.4%, thanks to another improvement in the franchise’s asset quality. Finally, the ratio in South America dropped slightly from 2.2% at the end of 2011 to 2.1% at the close of December 2012.
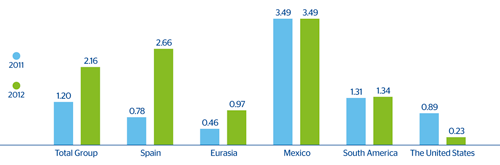
The Group’s risk premium, which measures the charge against earnings made for net loss provisioning per lending unit, increased by 96 basis points in 2012 to 2.16%. By business area, the risk premium increased to 2.66% in Spain and 0.97% in Eurasia, while in Mexico it remained at 3.49% and in South America at 1.34%. In the United States it fell by 66 basis points to 0.23%.
Provisions for customer risk increased to €14,804m over the year. This represents an increase of 52.8% on the figure at the close of December 2011, mainly due to a significant increase in provisions in Spain and, to a lesser extent, to the incorporation of Unnim. As a result, the Group’s coverage ratio has improved by 11 percentage points to 72%. By business area, Spain and the United States increased their ratios to 67%, 90%, respectively. South America maintained its ratio at 146%. Mexico closed the year at 114% and Eurasia at 87%.
29 BBVA Group. Risk premiums by business area
(Percentage)
30 BBVA Group. NPA and coverage ratios
(Percentage)