

BBVA Group Highlights
(Consolidated figures)
 Download Excel
|
|
31-12-12 | Δ% | 31-12-11 | 31-12-10 |
|---|---|---|---|---|
| Balance sheet (million euros) | ||||
| Total assets | 637,785 | 6.7 | 597,688 | 552,738 |
| Customer lending (gross) | 367,415 | 1.7 | 361,310 | 348,253 |
| Deposits from customers | 292,716 | 3.7 | 282,173 | 275,789 |
| Other customer funds | 159,285 | 10.4 | 144,291 | 146,188 |
| Total customer funds | 452,001 | 6.0 | 426,464 | 421,977 |
| Total equity | 43,802 | 9.3 | 40,058 | 37,475 |
| Income statement (million euros) | ||||
| Net interest income | 15,122 | 15.0 | 13,152 | 13,316 |
| Gross income | 22,441 | 12.1 | 20,028 | 20,333 |
| Operating income | 11,655 | 13.3 | 10,290 | 11,573 |
| Income before tax | 1,659 | (51.9) | 3,446 | 6,059 |
| Net attributable profit | 1,676 | (44.2) | 3,004 | 4,606 |
| Net attributable profit adjusted (1) | 4,406 | (2.2) | 4,505 | 4,872 |
| Data per share and share performance ratios | ||||
| Share price (euros) | 6.96 | 4.2 | 6.68 | 7.56 |
| Earning per share adjusted (euros) (1) | 0.82 | (10.3) | 0.92 | 1.16 |
| Book value per share (euros) | 8.04 | (3.8) | 8.35 | 8.17 |
| P/BV (Price/book value; times) | 0.9 |
|
0.8 | 0.9 |
| PER (Price/earnings; times) | 21.5 |
|
10.9 | 7.4 |
| Yield (Dividend/price; %) | 6.0 |
|
6.3 | 5.6 |
| Significant ratios (%) | ||||
| ROE (Net attributable profit adjusted/average equity) (1) | 10.5 |
|
11.9 | 16.6 |
| ROTE (Net attributable profit adjusted/average tangible equity) (1) | 13.2 |
|
16.0 | 23.3 |
| ROA (Net income adjusted/average total assets) (1) | 0.81 |
|
0.88 | 0.94 |
| RORWA(Net income adjusted/average risk – weighted assets)(1) | 1.51 |
|
1.55 | 1.73 |
| Efficiency ratio | 48.1 |
|
48.6 | 43.1 |
| Risk premium | 2.16 |
|
1.20 | 1.33 |
| NPA ratio | 5.1 |
|
4.0 | 4.1 |
| NPA coverage ratio | 72 |
|
61 | 62 |
| Capital adequacy ratios (%) | ||||
| Core capital | 10.8 |
|
10.3 | 9.6 |
| Tier I | 10.8 |
|
10.3 | 10.5 |
| BIS II ratio | 13.0 |
|
12.9 | 13.7 |
| Non financial indicators | ||||
| Individual customer satisfaction rate (%) (2) | 7.1 |
|
7.5 | 7.5 |
| Number of jobs created (net) (3) | 3,773 |
|
3,200 | 3,255 |
| Global employee satisfaction index (4) | 76 |
|
n.a. | 73 |
| Diversity: Ratio of men to women in the staff (%) | 47/53 |
|
48/52 | 48/52 |
| Socially responsible mutual funds (SRI) (%) (5) | 2.6 |
|
2.4 | 2.1 |
| Attributable profit dedicated to community involvement programs (%) (6) | 4.8 |
|
2.5 | 1.7 |
| Number of beneficiaries of the Global Financial Literacy Plan | 1,159,032 |
|
814,483 | 416,325 |
| Number of microentepreneurs supported by the BBVA Microfinance Foundation | 1,293,514 |
|
948,508 | 620,584 |
| Other information | ||||
| Number of shares (millions) | 5,449 | 11.1 | 4,903 | 4,491 |
| Number of shareholders | 1,012,864 | 2.6 | 987,277 | 952,618 |
| Number of employees (7) | 115,852 | 4.7 | 110,645 | 106,976 |
| Number of branches (7) | 7,978 | 7.0 | 7,457 | 7,361 |
| Number of ATMs (7) | 20,177 | 7.4 | 18,794 | 17,055 |
(2) 1 - 10 scale. Only for Spain, according to the consolidation scope of each year. Source: FRS Inmark.
(3) Staff variation, without considering the inclusion of Unnim and the sale of Puerto Rico in 2012.
(4) Biannual survey. Without considering Unnim employees, as the survey was carried out before its incorporation to BBVA Group.
(5) As percentage of total investment and pension funds under management.
(6) Attributable profit allocated, according to the LBG model for measuring and communicating corporate community investment.
(7) Excluding Garanti.
Gross income(million euros) 
|
Efficiency ratio(Percentage) 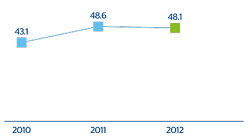
|
|---|---|
Net attributable profit (1)(Million euros) 
(1) Adjusted |
Earning per share (1)(Euros) 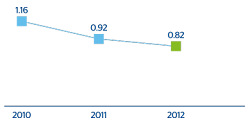
(1) Adjusted |
Core capital(Million euros) 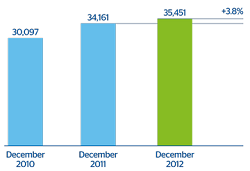
|
Core capital ratio(Percentage) 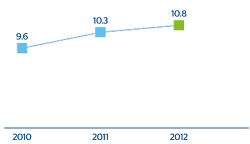
|