
Expected losses in the performing portfolio, expressed in consolidated terms and adjusted to the economic cycle average, stood at €3,859m as of the close of December 2012, a year-on-year increase of 10.2% on comparable data. In attributable terms, and also not including the non-performing portfolio, the expected losses as of December 2012 stood at €3,541m, 9.0% higher than the previous year, on comparable data.
The BBVA Group main portfolios show expected losses and economic capital as are detailed in the table Risk statistics for the BBVA Group’s main performing portfolios”.
Risk statistics for the BBVA Group’s main performing portfolios
 Download Excel
|
|
Exposure (1) | Expected loss (2) | Economic capital | ||
|---|---|---|---|---|---|
| Portfolios | Million euros | Million euros | % | Million euros | % |
| Retail mortgage | |||||
| Spain | 91,010 | 99 | 0.11 | 1,322 | 1.45 |
| Mexico | 10,132 | 264 | 2.60 | 426 | 4.21 |
| Other | 20,691 | 109 | 0.53 | 449 | 2.17 |
| Total | 121,833 | 471 | 0.39 | 2,197 | 1.80 |
| Other retail portfolios (3) | |||||
| Spain | 27,156 | 205 | 0.75 | 1,452 | 5.35 |
| Mexico | 14,940 | 601 | 4.02 | 1,690 | 11.31 |
| Other | 32,194 | 770 | 2.39 | 2,429 | 7.54 |
| Total | 74,291 | 1,576 | 2.12 | 5,571 | 7.50 |
| Companies and institutions (4) | |||||
| Spain | 105,331 | 708 | 0.67 | 4,832 | 4.59 |
| Mexico | 23,450 | 252 | 1.07 | 1,122 | 4.78 |
| Other | 114,452 | 695 | 0.61 | 4,036 | 3.53 |
| Total | 243,232 | 1,655 | 0.68 | 9,990 | 4.11 |
(2) Excludes non-performing portfolios.
(3) Other retail portfolios = Consumer finance + Credit and debit cards + SME´s + Other retail.
(4) Companies and institutions = Corporate + Companies + Developer + Institutions.
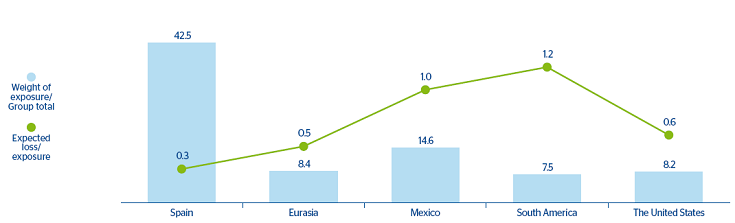
Chart 23 shows expected loss by business area as of 31-12-2012. Spain, with an exposure amounting to 42.5% of the total, has an expected loss-to-exposure ratio of 0.3%; Eurasia, with an exposure of 8.4%, has a ratio of 0.5%; Mexico has a weight of 14.6% and a ratio of 1.0%; South America a weight of 7.5% and a ratio of 1.2%; and the United States, a weight of 8.2% and a ratio of 0.6%.
23 BBVA Group. Attributable expected losses (balances not in default) by business area
(Percentage over exposure as of 31-12-2012)