

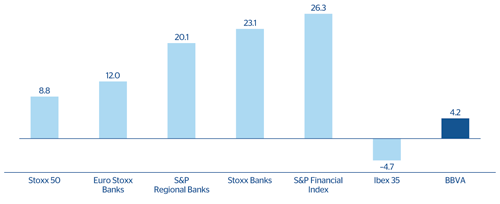
Stock-market indexes perform better in the United States than in Europe in 2012
Following a 2011 marked by a slowdown in macroeconomic indicators, global economic activity once again weakened in the first half of 2012, when risks materialized related, above all, to continued sovereign tensions in Europe. This led to a downward review of macroeconomic growth outlook throughout the first part of the year. In the summer there was a significant decrease in the risk premiums thanks to the reduction of tail risks, following decisive action by the U.S. Federal Reserve (FED) with its QE3 program, and the European Central Bank (ECB), with the implementation of a sovereign bond buyback program, under strict conditionality and subject to previous request by the country involved. The result was a recovery of growth expectations for the U.S. economy and, to a lesser extent, for the European economy. This positively affected the performance of the stock market indexes in the different regions. In the United States, the S&P 500 index increased 13.4% since the close of 2011, while the Stoxx 50 index in Europe rose by 8.8%. In Spain, the Ibex 35 index fell back 4.7% over the same period.
In Europe, the Stoxx Banks index performs better than the Euro Stoxx Banks index
In Europe, the financial tensions associated with resolving the economic and institutional crisis have been the main barrier to the area’s economic recovery in recent quarters. Although it is undeniable that significant measures have been taken to resolve it, there are still no signs of a clear roadmap for greater fiscal and financial integration. Given this, the financial sector has continued to reflect the differences in Europe, apparent in the better relative performance of the Stoxx Banks index, which includes non-euro zone banks, and which in 2012 rose 23.1%, compared with the Euro Stoxx Banks index (up 12.0% over the same period). Also of note is the recovery of the peripheral banks in the second half of the year, following the announcement of outright monetary transactions (OMT) by the ECB. In the United States, the S&P Financials Index and the S&P Regional Banks Index outperformed the European indexes, at 26.3% and 20.1%, respectively, for the year.
In Spain, BBVA share outperforms the Ibex 35 index
In Spain, the year was marked by unfavorable macroeconomic data, the implementation of structural reforms and austerity measures, and the high cost of financing, though it fell significantly following the announcement by the ECB of the implementation of the sovereign bond buyback program, which was conditional on requesting a bailout. In the Spanish financial sector, significant progress has been made in the coverage of “toxic” assets (with the publication of two Royal Decree-Laws which require banks to increase coverage for real-estate exposure) and also in the identification of undercapitalized banks (publication of “bottom-up stress test” results conducted by Oliver Wyman). Details of the structure and funding of the so-called “bad bank” (SAREB) have also been outlined. A credible and satisfactory completion of this process can be crucial in shaping a positive market feeling of the financial sector and its future growth potential. Given this, BBVA share has outperformed the Ibex 35 index in 2012.
5 Evolution of the principal stock-market indexes and the BBVA share
(Percentage)
BBVA’s earnings are notable for the strength of recurring revenue and the Group’s good solvency and liquidity levels
BBVA earnings figures presented in 2012 have, in general, been favorably received. At the operational level, analysts took a positive view of the Bank’s strong revenue figures. The Group once more surprised by its capacity to generate earnings in its international businesses and its solvency and liquidity levels. In Spain, net interest income performance has been positively highlighted. Analysts have also underlined the strength of earnings in South America and Mexico, and in particular the trend in recurring revenue. In addition, the announcement of the agreements reached for the sale of Administradora de Fondos para el Retiro, Bancomer S.A. de C.V. in Mexico, BBVA Horizonte Sociedad Administradora de Fondos de Pensiones y Cesantías S.A. in Colombia and Administradora de Fondos de Pensiones Provida S.A. in Chile, have in general been received positively. From a strategic point of view, analysts consider that the sale of the pension business makes sense, since its synergies with the Group’s core business are very limited, and because investors have shown a strong buying interest.
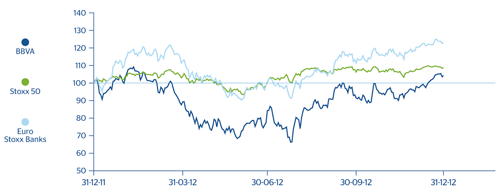
The BBVA share ends the year above the price levels posted at the end of 2011
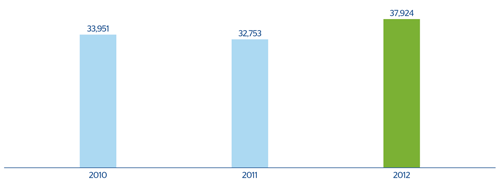
BBVA’s share price fluctuated over the year between €4.31 and €7.35, and closed as of 31-Dec-2012 at €6.96 per share (€6.68 a year earlier), which represents a market capitalization of €37,924m. The price/earnings ratio is 21.5, compared with 10.9 in December 2011 (both figures have been calculated using the price and net attributable profit at the close of the year taken into account). The price/book value ratio is 0.9 (0.8 in 2011).
6 Share price index
(31-12-2011=100)
7 BBVA’s market capitalization
(Million euros)
The BBVA share and share performance ratios
 Download Excel
|
|
31-12-12 | 31-12-11 | 31-12-10 |
|---|---|---|---|
| Number of shareholders | 1,012,864 | 987,277 | 952,618 |
| Number of shares issued | 5,448,849,545 | 4,903,207,003 | 4,490,908,285 |
| Daily average number of shares traded | 68,701,401 | 60,363,481 | 68,197,775 |
| Daily average trading (million euros) | 406 | 452 | 655 |
| Maximum price (euros) | 7.35 | 9.49 | 13.27 |
| Minimum price (euros) | 4.31 | 5.03 | 7.00 |
| Closing price (euros) | 6.96 | 6.68 | 7.56 |
| Book value per share (euros) | 8.04 | 8.35 | 8.17 |
| Market capitalization (million euros) | 37,924 | 32,753 | 33,951 |
| Price/book value (times) | 0.9 | 0.8 | 0.9 |
| PER (Price/earnings; times) | 21.5 | 10.9 | 7.4 |
| Yield (Dividend/price; %) | 6.0 | 6.3 | 5.6 |
BBVA maintains its shareholder remuneration policy
Shareholder remuneration for 2012 remains at €0.42 per share. In other words, both the amount registered in recent years and the current dividend scheme are being maintained. The decision by the Bank’s management to maintain the dividend paid in previous years sends out a clear statement of confidence despite the complicated setting. Two cash dividends have been paid out for a gross amount of €0.10 per share (on 10-Jul-2012 and 10-Jan-2013, respectively). In addition, payment of €0.10 per share has been made under the “dividend option” flexible remuneration system agreed at the Annual General Meeting (AGM) on March 16, 2012. This program offers shareholders the option to receive the dividend in newly issued BBVA shares or in cash. Around 80% of shareholders opted to receive newly issued BBVA shares, which once more confirms the success of this new remuneration system. A proposal will also be made to the next AGM to be held on March 15, 2013 in relation to the payment of a final dividend for a gross amount of €0.12 per share. This dividend will mean a slight increase of the pay-out ratio, which will be 51% compared with 46% in the previous year (on the adjusted net attributable profit), and a dividend yield of 6%, one of the most attractive in the sector. Finally, it is worth noting that BBVA not only offers attractive and differential shareholder remuneration, but also renders to shareholders a variety of exclusive products and services under very advantageous conditions.
8 BBVA Group. Dividend per share
(Euros)
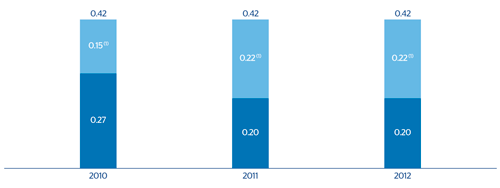
(1) “Dividend option”.
BBVA capital ownership remains well diversified
At the close of 2012, the number of BBVA shares stood at 5,449 million. The increase on the figure recorded at the end of 2011 (4,903 million) is due to the implementation of the so-called “dividend option” and the issue of ordinary BBVA shares carried out to pay for the voluntary conversion on March 30 and for the mandatory conversion on June 30 of the mandatory convertible subordinated bonds issued in December 2011.
The number of BBVA shareholders as of 31-Dec-2012 stood at 1,012,864, compared with 987,277 on 31-Dec-2011, a 2.6% increase. Shareholder dispersion was maintained in 2012, with no significant holding. 89.4% of the shareholders own fewer than 4,500 shares (compared with 90.6% on 31-Dec-11), representing 12.85% of the capital stock (compared with 13.0% on 31-Dec-12) and an average investment per shareholder of 5,380 shares (4,966 in 2011).
Shareholder structure
(31-12-2012)
Download Excel
| Number of shares | Shareholders | Shareholders | ||
|---|---|---|---|---|
|
|
Number | % | Number | % |
| Up to 150 | 265,660 | 26.2 | 19,171,852 | 0.4 |
| 151 to 450 | 228,712 | 22.6 | 61,702,640 | 1.1 |
| 451 to 1800 | 286,960 | 28.3 | 267,103,613 | 4.9 |
| 1,801 to 4,500 | 123,687 | 12.2 | 352,158,649 | 6.5 |
| 4,501 to 9,000 | 55,657 | 5.5 | 349,939,412 | 6.4 |
| 9,001 to 45,000 | 46,058 | 4.5 | 804,116,358 | 14.8 |
| More than 45,001 | 6,130 | 0.6 | 3,594,657,021 | 66.0 |
| Total | 1,012,864 | 100.0 | 5,448,849,545 | 100.0 |
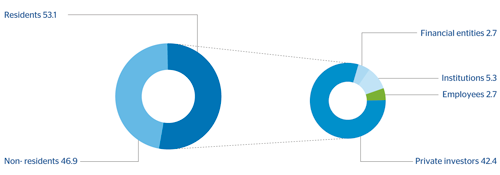
A total of 53.1% of the Group’s shareholders’ equity belongs to residents in Spain. In terms of type of shareholder, 42.4% belongs to private investors, 2.7% to employees and the remaining 8.0% to institutional investors. There is a high percentage of non-resident shareholders, who own 46.9% of the capital stock (in December 2011 they owned 43.5% of BBVA capital). This once more reflects the confidence in and recognition of the BBVA name on the international markets in the current difficult environment.
9 BBVA Group. Shareholder structure 31-12-12
(Percentage)
As in 2011, the shares trade on the continuous market in Spain, on the New York Stock Exchange (as ADSs represented by ADRs) and on Mexico stock market.
High liquidity of BBVA share
The BBVA share was traded on each of the 256 days in the stock market year of 2012. A total of 17,596 million shares were traded on the stock exchange in this period, representing 323% of shareholders’ equity. Thus the daily average volume of traded shares was 69 million, 1.27% of the total number of shares and an effective daily average of €406m.
BBVA is part of the main stock indexes and sustainability
BBVA shares were included in the Ibex 35 and Stoxx 50 reference indexes, with a 12.075% weighting in the former and 2.59% in the latter, as well as in several banking industry indexes, most notably the Stoxx Banks, with a weighting of 5.54%, and the Euro Stoxx Banks, with a weighting of 13.77%.
Finally, BBVA is also increasingly represented in the leading sustainability indexes worldwide, such as the Dow Jones Sustainability, FTSE4Good and the MSCI indexes. More and more institutional investors use ESG (environmental, social, ethical and corporate governance) ratings in addition to financial fundamentals when making investment decisions. BBVA has been given one of the best ratings by nearly all analysts and ESG indexes.
Principales índices de sostenibilidad con presencia de BBVA
(Datos a 31 de diciembre de 2012)
Download Excel
|
|
|
Weighting (%) |
|---|---|---|

|
DJSI World | 0.59 |
|
|
DJSI Europe | 1.38 |
|
|
DJSI Eurozone | 2.86 |

|
ASPI Eurozone Index | 2.13 |
|
|
Ethibel Sustainability Index Excellence Europe | 1.45 |
|
|
Ethibel Sustainability Index Excellence Global | 1.02 |

|
MSCI World ESG Index | 0.42 |
|
|
MSCI World ex USA ESG Index | 0.84 |
|
|
MSCI Europe ESG Index | 1.45 |
|
|
MSCI EAFE ESG Index | 0.94 |

|
FTSE4Good Global | 0.37 |
|
|
FTSE4Good Global 100 | 0.60 |
|
|
FTSE4Good Europe | 0.85 |
|
|
FTSE4Good Europe 50 | 1.40 |