The credit risk assessment in OTC financial instruments is made by means of a Monte Carlo simulation, which calculates not only the current exposure of the counterparties, but also their possible future exposure to fluctuations in market variables.
The model combines different credit risk factors to produce distributions of future credit losses and thus allows a calculation of the portfolio effect; in other words, it incorporates the term effect (the exposure of the various transactions presents potential maximum values at different points in time) and the correlation effect (the relation between exposures, risk factors, etc. are normally different from 1). It also uses credit risk mitigation techniques such as legal netting and collateral agreements.
The maximum credit risk exposure in derivatives with counterparties in the Group as of 31-Dec-2012 stood at €60,796m, an increase of 4% on 2011 year-end. Excluding intra-group counterparties, the maximum risk in derivatives is €59,755m.) Maximum exposure to credit risk in derivatives at BBVA, S.A. is estimated at €55,516m (€55,081m excluding intra-group counterparties). BBVA S.A.’s overall reduction in terms of exposure due to netting and collateral agreements is €42,375m.
Therefore, the net risk in derivatives at BBVA, S.A. as of December 31, 2012 is €13,123m. Excluding the exposure with intra-group counterparties, the net risk in derivatives at BBVA, S.A. as of December 31, 2012 is €12,707m.
Counterparty risk by type of product and by sector. Maximum exposure in BBVA, S.A.
(Million euros)
 Download Excel
|
|
Derivatives | Depos | Repurchases | Rest | Total |
|---|---|---|---|---|---|
| Financial sector | 4,788 | 231 | 162 | 53 | 5,234 |
| Corporate | 5,245 | - | - | (50) | 5,195 |
| Sovereign | 80 | 17 | - | 3 | 100 |
| Branches | 2,594 | - | - | - | 2,594 |
| Total | 12,707 | 248 | 162 | 6 | 13,123 |
The table above shows the distribution by sectors and by products of the amounts of the maximum credit risk exposure in financial instruments in BBVA, S.A. By sectors, exposure is mainly concentrated in financial institutions (40%) and corporates (40%).
The table below shows the distribution by maturity of the maximum exposure amounts in financial instruments. Maturity index is 3.5 years.
Maturity vector by rating and tranches at BBVA, S.A. (excluding intra-group counterparties. Data as of December 2012)
(Million euros)
 Download Excel
|
|
Up to 3 months | Up to 12 months | Up to 3 years | Up to 5 years | Up to 10 years | More than 10 years |
|---|---|---|---|---|---|---|
| AAA | - | 108 | - | - | 439 | 681 |
| AA | 19 | 45 | 133 | 75 | 75 | 37 |
| A | 1,171 | 808 | 758 | 310 | 612 | 370 |
| BB | 136 | 960 | 717 | 218 | 368 | 288 |
| Non investment grade | 94 | 430 | 549 | 329 | 336 | 510 |
| NR | 5 | 24 | 60 | 36 | 44 | 36 |
| D | - | 6 | 12 | 15 | 115 | 174 |
The counterparty risk assumed in this activity involves entities with a high credit rating (equal to or above A– in 41% of cases).
37 Distribution by rating of maximum exposure in BBVA, S.A. (Excluding intra-group counterparties)

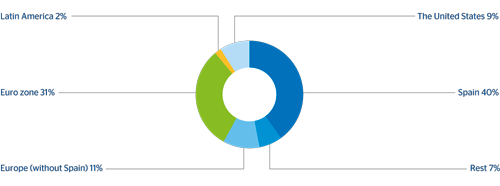
By geographical areas, the maximum exposure of BBVA, S.A. is in counterparties in Europe (82%) and the United States (9%), which together account for 91% of the total.
38 Geographical distribution of maximum exposure in BBVA, S.A. (Excluding intra-group counterparties)


