
The most significant aspects in 2012 regarding credit risk are summarized below:
- The Group’s NPA ratio rose due to the macroeconomic situation previously mentioned, together with the decline in lending in Spain and in the Bank’s CIB portfolios, mainly in developed countries.
- There was also a new increase in provisions in Spain to cover the gradual impairment of real-estate portfolios and assets within the scope of the Royal Legislative Decrees 02/2012 and 18/2012, in order to comply with the provisions of these two laws.
- In the rest of the geographical areas, asset quality was stable or improved.
As a result, the Group ended 2012 with its main risk indicators as expected and comparing positively with those of most of its peers. As of 31-Dec-2012, the NPA ratio stood at 5.1%, the coverage ratio at 72% and the cumulative risk premium at 2.16%.
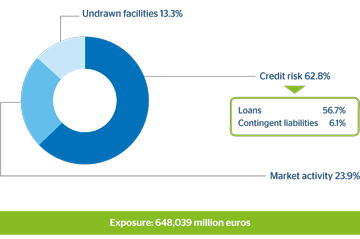
BBVA’s maximum exposure to credit risk stood at €648,039m at the close of December 2012, with a year-on-year increase of 3.7%. Customer credit risks (including contingent liabilities), which account for 62.8% of total credit risk, increased by 1.6% over the same time period. This increase was due mainly to two factors: the incorporation of Unnim and the growth in lending in emerging countries. Potential exposure to credit risk in market activities (23.9% overall), including potential exposure to derivatives (once netting and collateral agreements are considered), also rose by 14.6%, particularly in fixed-income, while undrawn facilities (13.3% overall) fell by 3.1%.
Maximum exposure to credit risk
(Million euros)
 Download Excel
|
|
31-12-11 | 31-12-11 Total Group |
31-12-10 Total Group |
||||||
|---|---|---|---|---|---|---|---|---|---|
|
|
Spain | Eurasia | Mexico | South America | The United States | Spain | Eurasia | ||
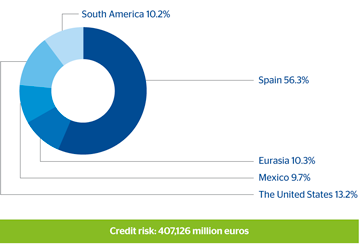
| Gross credit risk (drawn) | 229,290 | 41,960 | 39,542 | 53,672 | 41,505 | 1,158 | 407,126 | 400,709 | 384,069 |
| Customer lending (gross) | 210,828 | 30,228 | 38,995 | 48,728 | 37,136 | 1,804 | 367,719 | 361,310 | 348,253 |
| Contingent liabilities | 18,463 | 11,732 | 547 | 4,944 | 4,369 | (646) | 39,407 | 39,398 | 35,816 |
| Market activity | 50,878 | 7,608 | 28,504 | 16,230 | 9,125 | 42,344 | 154,689 | 134,937 | 129,398 |
| Credit entities | 12,463 | 2,327 | 4,808 | 3,332 | 1,368 | 2,224 | 26,522 | 26,107 | 23,636 |
| Fixed income | 25,275 | 5,280 | 22,460 | 10,107 | 7,263 | 40,120 | 110,505 | 88,621 | 88,081 |
| Derivatives | 13,141 | - | 1,235 | 2,792 | 494 | - | 17,662 | 20,209 | 17,680 |
| Undrawn facilities | 27,241 | 16,769 | 13,366 | 6,521 | 22,157 | 168 | 86,223 | 88,978 | 86,790 |
| Maximum exposure to credit risk | 307,410 | 66,337 | 81,412 | 76,424 | 72,787 | 43,669 | 648,039 | 624,624 | 600,257 |
Download Excel
16 BBVA Group. Maximum exposure to credit
|
17 BBVA Group. Gross exposure to credit
|
|---|
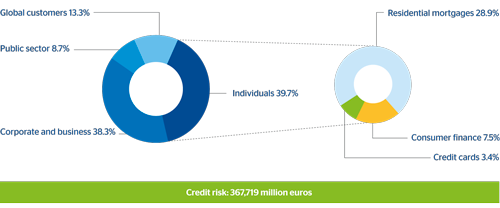
18 BBVA Group. Exposure to customer lending (gross). Distribution by portfolio
(31-12-2012)
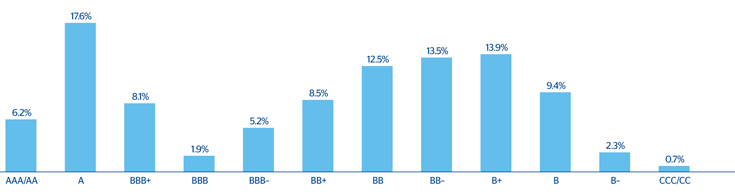
The exposure breakdown by rating of the parent company and subsidiaries in Spain, including corporations, financial institutions, and sovereign institutions and customers, shows 53.4% of A or better ratings. Also shown is the breakdown by rating of the business and developer segments handled by BBVA Spain, and of the loan book with corporates and financial institutions in Mexico.
19 Distribution by rating in Spain (1)
(Exposure as of 31-12-2012)
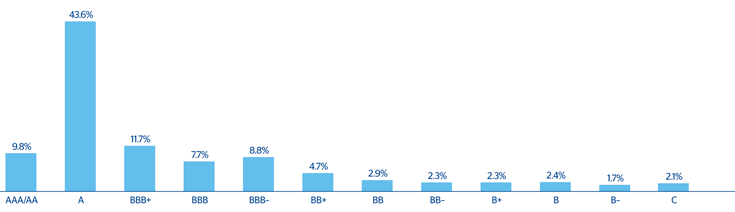
20 Distribution by rating. Corporates and developers in Spain (1)
(Exposure as of 31-12-2012)
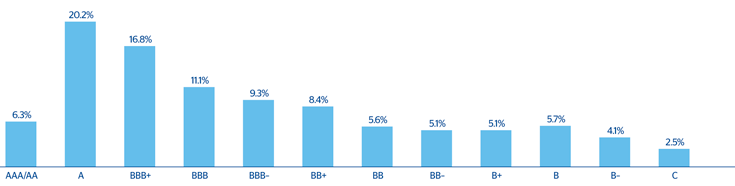
The breakdown of the loan book in Mexico with corporates and financial institutions by rating in Mexico is shown in Chart 21.
21 Distribution by rating in Mexico
(Exposure as of 31-12-2012)