

In 2012, BBVA Group reported a net attributable profit of €1,676m. The main feature of this result is the high quality of revenue, despite the hugely difficult and demanding background in which it has been generated. The Group has thus demonstrated for yet another year its high capacity to generate recurrent earnings, which have increased quarter-on-quarter, with an accumulated growth of 12.8% over the year. This standout performance is due to BBVA’s approach to banking, as described in the “Environment and positioning” section of this report.
The most significant aspects of 2012, from the standpoint of earnings, are:
- Sound recurrent revenue. Net interest income is above the level of 2011, while net fees and commissions are also up on the previous year, despite the regulatory restrictions that came into force in some geographical areas and lower activity in Spain.
- Significant contribution from NTI, particularly in the last two quarters of the year.
1 BBVA Group. Income evolution
(Million euros)

A significant increase in provisions in Spain to cover the gradual impairment in real-estate portfolios and assets.
2 BBVA Group. Loan-loss and real-estate provisioning (1)
(Million euros)
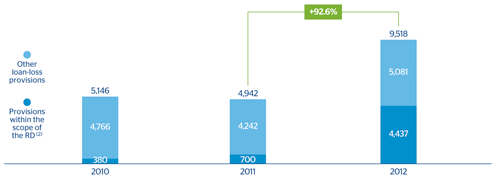
(2) Includes loan-loss provisions and provisions related to foreclosed and asset purchases within the scope
of the royal Decree-Laws 02/2012 and 18/2012 (RD)
Consolidated income statement
(Million euros)
 Download Excel
|
|
2012 | Δ% | Δ% at constant exchange rates | 2011 | 2010 |
|---|---|---|---|---|---|
| Net interest income | 15,122 | 15.0 | 11.0 | 13,152 | 13,316 |
| Net fees and commissions | 4,353 | 8.0 | 4.9 | 4,031 | 4,034 |
| Net trading income | 1,767 | 19.3 | 15.3 | 1,481 | 1,827 |
| Dividend income | 390 | (30.6) | (30.9) | 562 | 529 |
| Income by the equity method | 727 | 22.1 | 22.1 | 595 | 331 |
| Other operating income and expenses | 82 | (60.3) | (53.1) | 206 | 297 |
| Gross income | 22,441 | 12.1 | 8.7 | 20,028 | 20,333 |
| Operating costs | (10,786) | 10.8 | 7.6 | (9,737) | (8,761) |
| Personnel expenses | (5,662) | 9.1 | 6.2 | (5,191) | (4,698) |
| General and administrative expenses | (4,106) | 10.8 | 7.4 | (3,707) | (3,309) |
| Depreciation and amortization | (1,018) | 21.4 | 17.2 | (839) | (754) |
| Operating income | 11,655 | 13.3 | 9.8 | 10,290 | 11,573 |
| Impairment on financial assets (net) | (7,980) | 88.8 | 84.6 | (4,226) | (4,718) |
| Provisions (net) | (651) | 28.2 | 25.6 | (509) | (475) |
| Other gains (losses) | (1,365) | (35.3) | (38.8) | (2,110) | (320) |
| Income before tax | 1,659 | (51.9) | (53.2) | 3,446 | 6,059 |
| Income tax | 275 | n.m. | n.m. | (206) | (1,345) |
| Net income from ongoing operations | 1,934 | (40.3) | (41.9) | 3,240 | 4,714 |
| Net income from discontinued operations | 393 | 59.8 | 50.3 | 245 | 281 |
| Net income | 2,327 | (33.2) | (35.1) | 3,485 | 4,995 |
| Non-controlling interests | (651) | 35.3 | 24.2 | (481) | (389) |
| Net attributable profit | 1,676 | (44.2) | (45.3) | 3,004 | 4,606 |
| Adjusted (1) | (2,730) | - | - | (1,501) | (266) |
| Net attributable profit (adjusted) (1) | 4,406 | (2.2) | (5.2) | 4,505 | 4,872 |
| Basic earnings per share (euros) | 0.32 |
|
|
0.62 | 1.10 |
| Basic earnings per share adjusted (euros) (1) | 0.82 |
|
|
0.92 | 1.16 |
Consolidated income statement: quarterly evolution
(Million euros)
Download Excel
| 2012 | 2011 | |||||||
|---|---|---|---|---|---|---|---|---|
|
|
4Q | 3Q | 2Q | 1Q | 4Q | 3Q | 2Q | 1Q |
| Net interest income | 3,910 | 3,877 | 3,741 | 3,594 | 3,482 | 3,284 | 3,213 | 3,173 |
| Net fees and commissions | 1,126 | 1,104 | 1,061 | 1,062 | 1,004 | 1,007 | 1,035 | 985 |
| Net trading income | 646 | 319 | 461 | 340 | 403 | (5) | 331 | 751 |
| Dividend income | 17 | 35 | 311 | 27 | 230 | 50 | 259 | 23 |
| Income by the equity method | 191 | 169 | 175 | 191 | 205 | 149 | 122 | 119 |
| Other operating income and expenses | (32) | 6 | 57 | 51 | 42 | 23 | 62 | 79 |
| Gross income | 5,858 | 5,512 | 5,806 | 5,265 | 5,368 | 4,508 | 5,022 | 5,130 |
| Operating costs | (2,855) | (2,771) | (2,633) | (2,528) | (2,597) | (2,408) | (2,426) | (2,307) |
| Personnel expenses | (1,472) | (1,447) | (1,396) | (1,347) | (1,372) | (1,294) | (1,277) | (1,247) |
| General and administrative expenses | (1,089) | (1,064) | (1,001) | (951) | (1,000) | (899) | (943) | (865) |
| Depreciation and amortization | (294) | (259) | (236) | (230) | (225) | (214) | (206) | (194) |
| Operating income | 3,003 | 2,741 | 3,173 | 2,738 | 2,770 | 2,100 | 2,596 | 2,824 |
| Impairment on financial assets (net) | (2,676) | (2,038) | (2,182) | (1,085) | (1,337) | (904) | (962) | (1,023) |
| Provisions (net) | (227) | (195) | (98) | (130) | (182) | (93) | (83) | (150) |
| Other gains (losses) | (269) | (561) | (311) | (223) | (1,719) | (166) | (155) | (71) |
| Income before tax | (168) | (53) | 582 | 1,299 | (466) | 937 | 1,397 | 1,579 |
| Income tax | 220 | 275 | 3 | (223) | 385 | (77) | (167) | (347) |
| Net income from ongoing operations | 52 | 222 | 584 | 1,076 | (81) | 860 | 1,229 | 1,232 |
| Net income from discontinued operations | 138 | 83 | 75 | 96 | 74 | 48 | 66 | 58 |
| Net income | 190 | 305 | 659 | 1,173 | (7) | 907 | 1,295 | 1,290 |
| Non-controlling interests | (170) | (159) | (154) | (168) | (132) | (103) | (106) | (141) |
| Net attributable profit | 20 | 146 | 505 | 1,005 | (139) | 804 | 1,189 | 1,150 |
| Adjusted (1) | (1,042) | (825) | (742) | (122) | (1,166) | (173) | (82) | (80) |
| Net attributable profit (adjusted) (1) | 1,061 | 971 | 1,247 | 1,127 | 1,026 | 978 | 1,271 | 1,229 |
| Basic earnings per share (euros) | 0.01 | 0.03 | 0.10 | 0.19 | (0.03) | 0.16 | 0.24 | 0.23 |
| Basic earnings per share adjusted (euros) (1) | 0.19 | 0.18 | 0.23 | 0.21 | 0.20 | 0.20 | 0.26 | 0.25 |
BBVA’s profitability improves in terms of gross income over average total assets (ATA) from 3.52% in 2011 to 3.60% in 2012. This is due to the aforementioned strength and high quality of revenue. Compared to the previous year, net interest income and NTI increase their contribution while fees and commissions and other income reduce it.
Costs over ATA slightly increase due to a greater weight of emerging countries. However, the growth is lower than the trend shown in the revenues. This produces operating income over ATA improves 6 basis points in the last twelve months reaching 1.87%.
This positive performance has enabled the Group to absorb the significant increase in provisions made to cover the impairment of assets related to the real-estate sector in Spain, which in turn resulted in a decline of ROA to 0.37%. Excluding these provisions and the badwill from Unnim, ROA stands at 0.81%, i.e. 7 basis points less than in 2011 (excluding the goodwill impairment charge in the United States posted in the fourth quarter of 2011).
Consolidated income statements (% over ATA)
Download Excel
|
|
2012 | 2011 | 2010 |
|---|---|---|---|
| Net interest income | 2.42 | 2.31 | 2.38 |
| Net fees and commissions | 0.70 | 0.71 | 0.72 |
| Net trading income | 0.28 | 0.26 | 0.33 |
| Other operating income and expenses | 0.19 | 0.24 | 0.21 |
| Gross income | 3.60 | 3.52 | 3.63 |
| Operating costs | (1.73) | (1.71) | (1.57) |
| Personnel expenses | (0.91) | (0.91) | (0.84) |
| General and administrative expenses | (0.66) | (0.65) | (0.59) |
| Depreciation and amortization | (0.16) | (0.15) | (0.13) |
| Operating income | 1.87 | 1.81 | 2.07 |
| Impairment on financial assets (net) | (1.28) | (0.74) | (0.84) |
| Provisions (net) and other gains (losses) | (0.32) | (0.46) | (0.14) |
| Income before tax | 0.27 | 0.61 | 1.08 |
| Income tax | 0.04 | (0.04) | (0.24) |
| Net income from ongoing operations | 0.31 | 0.57 | 0.84 |
| Net income from discontinued operations | 0.06 | 0.04 | 0.05 |
| Net income (ROA) | 0.37 | 0.61 | 0.89 |
| Net income adjusted (ROA adjusted) | 0.81 | 0.88 | 0.94 |
| Non-controlling interests | (0.10) | (0.08) | (0.07) |
| Net attributable profit | 0.27 | 0.53 | 0.82 |
| Net attributable profit (adjusted) | 0.71 | 0.79 | 0.87 |
| Memorandum item: |
|
|
|
| Average total assets (million euros) | 623,894 | 568,579 | 559,558 |