

Strong franchise, helps us outperform
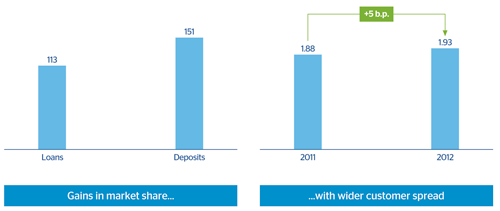
37 Market share. Lending and deposits(Year-on-year change. Figures as of |
Customer spread
|
|---|
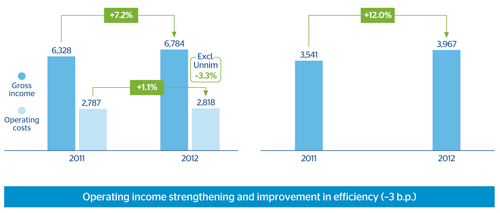
Containment of costs, which grew slower than revenue
38 Gross income and operating costs(Million euros) |
Operating income(Million euros) |
|---|
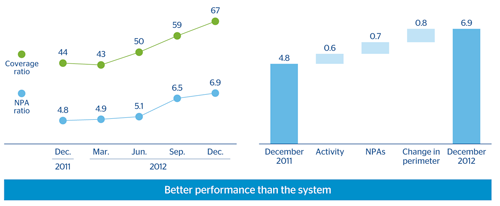
NPAs are in line with expectations
39 NPA and coverage ratios(Percentage) |
NPA ratio breakdown(Percentage) |
|---|
Income statement
(Million euros)
|
|
Accumulated | Year-on-year change 2012-2011 | |
|---|---|---|---|
|
|
2012 | Absolute | Percentage |
| Net interest income | 4,836 | +445 | 10.1 |
| Gross income | 6,784 | +457 | 7.2 |
| Operating income | 3,967 | +426 | 12.0 |
| Income before tax ex provisions related to real estate | 1,699 | –382 | –18.4 |
| Net attributable profit (adjusted) | 1,211 | –267 | –18.2 |
| Net attributable profit | –1,267 | –2,619 | n.m. |