This area comprises the banking, pensions and insurance business conducted in Mexico by the BBVA Bancomer financial group.
The Mexican economy has shown slow recovery in the second half of 2009, being boosted by private consumption and public investment. Positive fiscal and monetary management and the sound Mexican financial system have enabled a fast change in the domestic demand trend with the relative maintenance of employment. The year-on-year decline in GDP to the end of 2009 (6.8%) is expected to be less than the drop estimated to mid-year.
In regard to consumer prices evolution, annual inflation has continued to go down during the last months of 2009, and the year ended with a rate of 3.6%. This was due to the continued low domestic demand, stabilization of the FX market and the favorable performance of non-underlying components (agricultural and energy prices). In this context, the Bank of Mexico has opted to reduce its reference interest rates (base borrowing rate) on several occasions to situate it at 4.5%, for a decrease of 375 basis points since the close of December 2008.
The peso exchange rate appreciated against the euro, rising 1.6% against year-end 2008. However, comparing average exchange rates, the Mexican currency depreciated 13.3% year-on-year. The aforementioned had a slightly positive impact on the area’s balance sheet and activity and a negative effect on the income statement. To provide a better picture of how the business has evolved, the comments below will refer to year-on-year change at a constant exchange rate unless otherwise indicated.
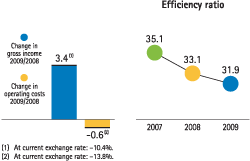
BBVA has further consolidated its leadership in Mexico throughout the financial crisis, growing the most significant items on its income statement. At year-end 2009, net interest income stood at €3,307m, having risen 2.7% year on year. This was the result of well focused price management and increased customer funds (6.8% more funds were gathered through current, savings and time deposits since the end of December 2008; current accounts grew 7.9%). Net fees and commissions income reached €1,077m. This 4.6% growth came from positive performance of charges on banking services and pension fund management. There was a 13.7% increase to €370 million in net trading income, as compared to the same period in 2008, due to an increase in income from transactions with customers and a favorable market environment. This, together with the solid results of the insurance business activity, helped gross income to rise 3.4% on 2008, for a total of €4,870 million in 2009.
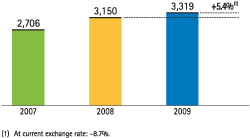
Transformation and efficiency plans were rolled out during 2009, bringing down operating costs by 0.6% year-on-year. And since revenues were strong, the year-end cost-income ratio stood at 31.9%, more than one percentage point below the figure of last year. The combined performance of revenues and costs meant that the year-to-end operating income rose 5.4% to €3,319m.
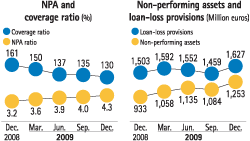
Total impairment on financial assets rose to €1,525 million, up 58.5% on 2008, which is mostly concentrated in consumer and credit card portfolios. Its increase is due to the deterioration of the economic cycle in 2009 to the application of tougher metrics to calculate the internal expected loss models for the credit card business. BBVA Bancomer was the only bank in Mexico to be certified by the national banking and securities authority (Comisión Nacional Bancaria y de Valores - CNBV) and the Bank of Spain to use internal expected loss models for credit cards. This has meant that it was less affected than other banks by the stricter provisioning standards established by the CNBV. If a standard calculation was used throughout the financial industry, i.e., if everything was booked to the income statement that prevailing legislation has allowed to charge against reserves, Bancomer would have one of the lowest costs of risk among its principal competitors. This is not just the outcome of more prudent risk management, with more restrictive acceptance policies, but also of applying expected loss criteria to calculate the level of provisions required.
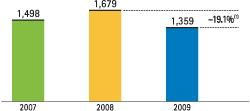
For the reasons described above and despite the adverse economic backdrop, the area recorded a net attributable profit of €1,359 million. The NPA ratio is at 4.3% at December 31, 2009 and the coverage ratio stands at 130%.
Mexico. Efficiency
(Percentage)
Mexico. Operating income
(Million euros at constant exchange rate)
Income Statement
(Million euros)
Download
|
|
|
|
|
|
Units: |
|
Mexico |
Banking Business |
Pensions and Insurance |
|
2009 |
∆% |
∆%¹ |
2008 |
2007 |
2009 |
∆% |
∆%¹ |
2008 |
2009 |
∆% |
∆%¹ |
2008 |
| Net interest income |
3,307 |
(11.0) |
2.7 |
3,716 |
3,505 |
3,251 |
(11.8) |
1.8 |
3,686 |
53 |
75.0 |
101.9 |
30 |
| Net fees and commissions |
1,077 |
(9.4) |
4.6 |
1,189 |
1,305 |
1,024 |
(8.0) |
6.2 |
1,113 |
51 |
(14.9) |
(1.8) |
60 |
| Net trading income |
370 |
(1.4) |
13.7 |
376 |
311 |
266 |
(7.2) |
7.1 |
287 |
104 |
17.0 |
35.0 |
89 |
| Other income/expenses |
116 |
(24.6) |
(13.0) |
154 |
115 |
(131) |
64.6 |
89.9 |
(80) |
256 |
(8.4) |
5.7 |
280 |
| Gross income |
4,870 |
(10.4) |
3.4 |
5,435 |
5,236 |
4,411 |
(11.9) |
1.7 |
5,007 |
464 |
1.1 |
16.7 |
459 |
| Administration costs |
(1,551) |
(13.8) |
(0.6) |
(1,800) |
(1,839) |
(1,423) |
(13.9) |
(0.7) |
(1,653) |
(127) |
(25.8) |
(14.4) |
(172) |
| Personnel expenses |
(725) |
(14.0) |
(0.7) |
(843) |
(879) |
(661) |
(15.4) |
(2.4) |
(781) |
(63) |
0.3 |
15.8 |
(63) |
| General and administrative expenses |
(761) |
(14.0) |
(0.7) |
(885) |
(858) |
(699) |
(12.7) |
0.7 |
(801) |
(62) |
(41.9) |
(33.0) |
(106) |
| Depreciation and amortization |
(65) |
(10.5) |
3.2 |
(73) |
(102) |
(63) |
(11.0) |
2.7 |
(71) |
(2) |
1.4 |
17.0 |
(2) |
| Operating income |
3,319 |
(8.7) |
5.4 |
3,634 |
3,397 |
2,988 |
(10.9) |
2.8 |
3,354 |
336 |
17.3 |
35.3 |
287 |
| Impairment on financial assets (net) |
(1,525) |
37.4 |
58.5 |
(1,110) |
(834) |
(1,525) |
37.4 |
58.5 |
(1,110) |
- |
- |
- |
- |
| Provisions (net) and other gains (losses) |
(21) |
(15.7) |
(2.7) |
(25) |
19 |
(21) |
(18.6) |
(6.1) |
(25) |
(1) |
n.m. |
n.m. |
- |
| Income before tax |
1,773 |
(29.1) |
(18.1) |
2,499 |
2,583 |
1,442 |
(35.0) |
(25.0) |
2,218 |
336 |
17.0 |
35.0 |
287 |
| Income tax |
(411) |
(26.5) |
(15.2) |
(560) |
(701) |
(325) |
(33.1) |
(22.8) |
(485) |
(88) |
14.7 |
32.4 |
(76) |
| Net income |
1,361 |
(29.8) |
(19.0) |
1,939 |
1,882 |
1,118 |
(35.5) |
(25.6) |
1,733 |
248 |
17.9 |
36.0 |
210 |
| Minority interests |
(2) |
45.1 |
67.4 |
(1) |
(2) |
- |
(35.7) |
(25.8) |
(1) |
(2) |
98.3 |
128.8 |
(1) |
| Net attributable profit |
1,359 |
(29.9) |
(19.1) |
1,938 |
1,880 |
1,117 |
(35.5) |
(25.6) |
1,733 |
246 |
17.5 |
35.6 |
210 |
¹At constant exchange rate.
Balance sheet
(Million euros)
Download
|
|
|
|
|
|
Units: |
|
Mexico |
Banking Business |
Pensions and Insurance |
|
31-12-09 |
D% |
D% (1) |
31-12-08 |
31-12-07 |
31-12-09 |
D% |
D% (1) |
31-12-08 |
31-12-09 |
D% |
D% (1) |
31-12-08 |
| Cash and balances with central banks |
6,236 |
15.8 |
13.9 |
5,387 |
5,540 |
6,236 |
15.8 |
13.9 |
5,387 |
- |
- |
- |
- |
| Financial assets |
23,564 |
13.2 |
11.3 |
20,825 |
26,501 |
20,053 |
10.6 |
8.8 |
18,133 |
3,725 |
24.7 |
22.7 |
2,987 |
| Loans and receivables |
30,764 |
(4.3) |
(5.8) |
32,145 |
30,902 |
30,619 |
(4.5) |
(6.0) |
32,050 |
196 |
21.3 |
19.3 |
162 |
| – Loans and advances to customers |
27,373 |
0.8 |
(0.8) |
27,151 |
28,211 |
27,293 |
0.8 |
(0.8) |
27,066 |
95 |
12.5 |
10.7 |
84 |
| – Loans and advances to credit institutions and other |
3,391 |
(32.1) |
(33.2) |
4,994 |
2,691 |
3,326 |
(33.3) |
(34.3) |
4,984 |
101 |
30.9 |
28.7 |
77 |
| Tangible assets |
753 |
6.3 |
4.5 |
709 |
794 |
747 |
6.2 |
4.4 |
703 |
7 |
17.7 |
15.8 |
6 |
| Other assets |
1,539 |
(6.1) |
(7.6) |
1,638 |
1,941 |
1,819 |
(2.2) |
(3.8) |
1,861 |
113 |
14.7 |
12.8 |
98 |
| Total assets/liabilities and equity |
62,857 |
3.5 |
1.9 |
60,704 |
65,678 |
59,474 |
2.3 |
0.7 |
58,134 |
4,041 |
24.2 |
22.2 |
3,253 |
| Deposits from central banks and credit institutions |
10,641 |
16.2 |
14.3 |
9,160 |
15,855 |
10,641 |
16.2 |
14.3 |
9,160 |
- |
- |
- |
- |
| Deposits from customers |
31,998 |
(1.4) |
(3.0) |
32,466 |
35,237 |
32,037 |
(1.5) |
(3.1) |
32,533 |
- |
- |
- |
- |
| Debt certificates |
3,187 |
1.9 |
0.3 |
3,127 |
1,845 |
3,187 |
1.9 |
0.3 |
3,127 |
- |
- |
- |
- |
| Subordinated liabilities |
1,499 |
(5.4) |
(7.0) |
1,585 |
1,959 |
1,862 |
(1.0) |
(2.6) |
1,881 |
- |
- |
- |
- |
| Financial liabilities held for trading |
4,085 |
(0.6) |
(2.2) |
4,110 |
939 |
4,085 |
(0.6) |
(2.2) |
4,110 |
- |
- |
- |
- |
| Other liabilities |
8,782 |
18.1 |
16.2 |
7,437 |
6,361 |
5,259 |
10.8 |
9.0 |
4,746 |
3,818 |
26.9 |
24.9 |
3,008 |
| Economic capital allocated |
2,664 |
(5.5) |
(7.0) |
2,818 |
3,483 |
2,403 |
(6.7) |
(8.2) |
2,576 |
223 |
(9.1) |
(10.6) |
245 |
¹ At constant exchange rate.
Relevant business indicators
Download
|
Mexico |
|
31-12-09 |
∆% |
∆%¹ |
31-12-08 |
31-12-07 |
| Total lending to customers (gross) |
28,996 |
1.2 |
(0.4) |
28,644 |
29,878 |
| Customer deposits² |
31,252 |
5.3 |
3.6 |
29,677 |
31,218 |
| Off-balance-sheet funds |
20,065 |
22.5 |
20.5 |
16,376 |
19,862 |
| . Mutual funds |
10,546 |
14.9 |
13.0 |
9,180 |
11,214 |
| . Pension funds |
9,519 |
32.3 |
30.1 |
7,196 |
8,648 |
| Other placements |
2,781 |
(1.7) |
(3.3) |
2,830 |
3,484 |
| Customer portfolios |
5,042 |
(3.0) |
(4.6) |
5,200 |
6,237 |
| Efficiency ratio (%) |
31.9 |
|
|
33.1 |
35.1 |
| NPA ratio (%) |
4.3 |
|
|
3.2 |
2.1 |
| Coverage ratio (%) |
130 |
|
|
161 |
255 |
¹ At constant exchange rate.
² Excluding deposits and repos issued by Bancomer's Markets unit.
Mexico. Risk premium
(Percentage)
¹ Includes Banamex, Santander, Banorte, HSBC, Scotiabank, based on reported data.
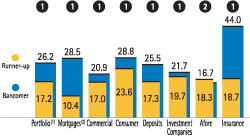
Mexico. Market share
(Data as of September 2009. Percentage)
¹ Total gross portfolio.
² Includes Sofoles.
Mexico
Mexico. Net attributable profit
(Million euros at constant exchange rate)
¹At current exchange rate: -29.9%.