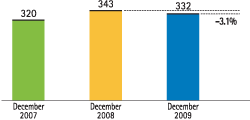
Total lending (gross) at December 31, 2009 stood at €332 billion after declining 3.1% year-on-year.
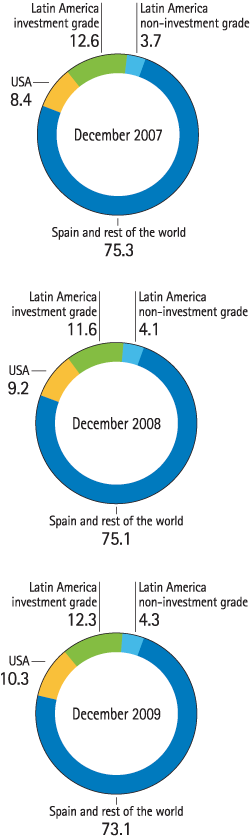
In terms of its geographic distribution, there was a notable increase in the weight of investment grade Latin America (Mexico, Chile and Peru), which as of December 31, 2009 represented 12.3% of the total, compared with 11.6% at the end of the previous year. This is because of the better relative credit appetite in these countries than in the domestic market. The weight of non-investment grade Latin American countries remained practically the same (4.3% in 2009 and 4.1% in 2008). The United States increased its share from 9.25 to 10.3% as a result of the incorporation of the Guaranty balances. The remaining 73.1% corresponds to Spain and the rest of the investment grade countries in the world.
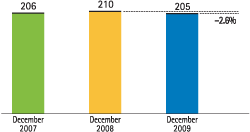
Of a total €205 billion lending to domestic customers in Spain, the public sector reported the biggest advance, at 18.1% year-on-year to €21 billion.
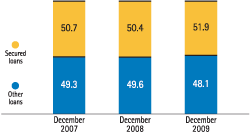
Loans to the domestic private sector fell 4.5% to €184 billion at year-end 2009 with items related to commercial activity and household consumption falling most. The volume of accounts receivable financing decreased 26.0%, credit card debtors fell 6.7% and other term loans (basically consumer loans and SME and corporates) fell 16.3%. Secured loans are the main component of domestic lending and they were almost unchanged compared to the third quarter, at €106 billion as of December 31, 2009, a similar figure (up 0.4%) to the same date in 2008. Nonperforming assets at year-end were €10,911 million, a significant increase over the year, and very much concentrated in the fourth quarter. The increase is due to a number of portfolios, mainly related to the real estate sector, which were declared doubtful following a detailed and rigorous examination by the Group.
Finally, lending to non-domestic customers amounted to €127 billion euros at the close of 2009, 3.9% below the figure of €133 billion as of December 31, 2008. Secured loans performed best and increased their weight in the nondomestic portfolio to 33.2% as of December 31, 2009, compared with 29.7% as of December 31, 2008. The increase in non-performing assets in this segment in the fourth quarter is basically due to an additional reclassification of the commercial real estate portfolio in the United States as rigorous as the one mentioned above for other domestic sectors.