Logotype

Credit risk in 2009

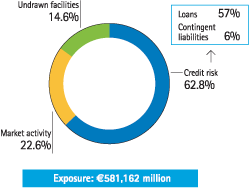
BBVA’s maximum exposure to credit risk stood at €581,162 million at December 31, 2009, a reduction of 1.0% compared with the end of 2008. Customer credit risks (including contingent liabilities), which account for 62.8%, fell 3.7% over December 2008, and potential exposure to credit risk in market activities (22.6% overall), including potential exposure to derivatives (including netting and collateral agreements) grew by 13.4% due to fixed-income exposure, while undrawn facilities (14.6% overall) fell by 8.4%.

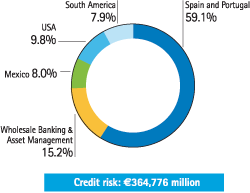
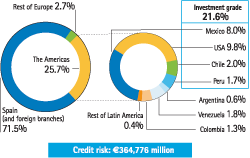
The geographic distribution of credit risk shows that the Americas have gained in weight, at nearly two percentage points over the year. The U.S. increased its participation through the acquisition of Guaranty Bank business in the third quarter of 2009. Overall, the Americasaccount for 25.7% of the Group’s overall credit risk, compared with 23.9% at the close of 2008. It is important to stress that most of the risk in the Americas (83.8%, compared with 83.2% in 2008) is located in investment grade countries.

A breakdown of customer loans by sector at year-end 2009 is given in the table below. The loan book in the local private sector in Spain stood at €183 billion, and the risks were highly diversified by sector and counterparty type.

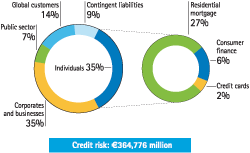
The distribution by portfolio shows that individuals’ risk accounts for 35% of total credit risk, residential mortgages being particularly important (27% overall, compared with 25% in December 2008). The LTV of this portfolio is at similar levels to December 2008, at around 54%, 51.5% in Spain (52.4% in 2008). The portfolio with LTV greater than 80% accounts for less than 20% of the total. The vast majority of the transactions’ destination is for the purchase of a first home (95%).

The developer segment in Spain (included in corporates) represents about 5% of total Group lending and 8% of total lending in Spain. Within this segment, finished developments has a significant weight (47%), with a LTV normally below 80%. It represents a lower risk than developments underway (24%) and land (29%). In the land segment most is urban land (75%).

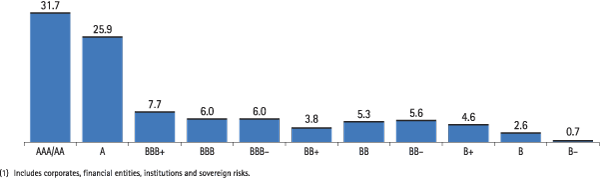
The breakdown by rating of exposure of the parent and subsidiaries in Spain, including corporates, financial entities, institutions and sovereigns shows 57.6% of A or better ratings.

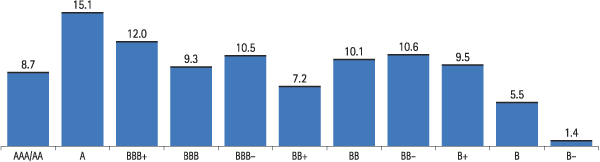
The breakdown by rating of SMEs and developer segment for the parent and subsidiaries in Spain is also shown.

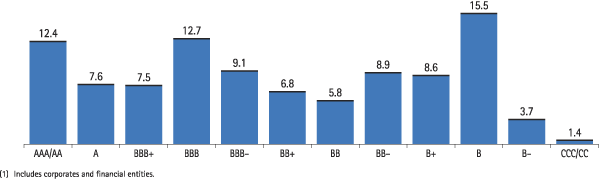
The breakdown of the loan book by rating in Mexico with corporates and financial institutions is shown in the chart.

Maximum exposure to credit risk

(Million euros)

Download


31-12-09 31-12-08 31-12-07

Spain and Portugal WB & AM Mexico The United States South America Corporate Activities Group Total Group Total Group Total
Gross credit risk (drawn) 216,255 55,482 29,290 35,801 28,859 (911) 364,776 378,635 357,169
Loans and receivables 204,357 39,561 28,963 34,108 26,222 (1,049) 332,162 342,682 320,310
Contingent liabilities 11,898 15,921 327 1,693 2,637 138 32,614 35,953 36,859
Market Activity 22,003 50,294 21,882 7,709 10,806 18,767 131,461 115,899 110,722
Credit entities 12,557 14,343 2,597 357 1,929 (14,536) 17,247 25,826 20,997
Fixed income 9,446 24,568 18,259 6,193 6,485 33,303 98,254 72,562 81,794
Derivatives - 11,383 1,026 1,159 2,392 - 15,960 17,511 7,931
Undrawn facilities 29,472 29,876 9,421 10,184 2,671 3,301 84,925 92,663 101,444
Subtotal 267,730 135,652 60,593 53,694 42,336 21,157 581,162 587,197 569,335
Others


39,176 43,185 18,309
Total


620,338 630,382 587,644

Maximum exposure to credit risk. Distribution by type of risk

(31-12-09)

Maximum exposure to credit risk. Distribution by type of risk

Exposure. Gross credit risk. Distribution by business area

(31-12-09)

Exposure. Gross credit risk. Distribution by business area

Customer ledning by sector

(Million euros)

Download


31-12-09 31-12-08 31-12-07

Residents Non-residents Group Total Group Total Group Total
Public sector 20,559 5,660 26,219 22,503 21,065
Agriculture 1,722 2,202 3,924 4,109 3,737
Industry 16,805 25,993 42,798 46,576 39,922
Real estate and construction 36,584 19,183 55,767 47,682 55,156
Commercial and financial 17,404 23,310 40,714 51,725 36,371
Loans to individual customers 87,948 38,540 126,488 127,890 121,462
Leasing 6,547 1,675 8,222 9,385 9,148
Others 15,960 10,995 26,955 31,452 32,810
Subtotal 203,529 127,558 331,087 341,322 319,671
Interest, fees and others 268 168 436 942 655
Total 203,797 127,726 331,523 342,264 320,326

Exposure. Credit risk. Geographical distribution

(31-12-09)

Exposure. Credit risk. Geographical distribution

Exposure. Gross credit risk. Distribution by portfolio

(31-12-09)

Exposure. Gross credit risk. Distribution by portfolio

Distribution by rating. Spain¹

(Exposure 31-12-09. Percentage)

Distribution by rating. Spain
¹Includes coprorates, financial entities, institutions and sovereign risks.

Distributing by rating. Spain: corporates and developers

(Exposure 31-12-09. Percentage)

Distributing by rating. Spain: corporates and developers

Distribution by rating. Mexico¹

(Exposure 31-12-09. Percentage)

Distribution by rating. Mexico
¹Includes corporates and financial entities.
Tools