Recovery of the stock market, which started at very low levels
In 2009, despite the recession, macroeconomic indicators in the major economies have shown signs of improvement in the final months of the year. In some emerging countries (mainly in Latin America) the crisis has only had a moderate effect. However, in Europe at the start of the year interest rates fell to all-time lows in the euro zone. In this context, the stock market has recovered significantly from its very low levels at the start of 2009, boosted by support measures adopted by many governments, greater investor confidence in markets and the improved results of some companies. The bigger rise in the Ibex 35 versus the major European and US indices is also worth noting.
Improved performance of the banking sector, despite the slowdown in the last quarter
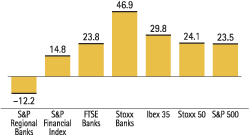
The banking sector was also helped by the recovery in the markets and the measures adopted by governments to mitigate the impact of the crisis on capital and liquidity. The injections of liquidity by the European Central Bank during the year aimed to steer the economy back to normal. They managed to improve the liquidity situation of the markets, with the result that during the second half of 2009 the banks increased their financing options. In addition, the publication of the stress tests in the United States led to greater visibility of the solvency situation of banks and of their expected results. Although until October the banking sector performed better than the market average, in the latter part of the year its performance slowed down. Investors’ perceptions have become less positive. Uncertainty about the new Basel regulations could have negatively influenced perceptions in the short term. All this has had the end result of a more positive change in the sector over the year than in the general indices. The best performance was that of the Stoxx Banks index in Europe, which closed the year up 46.9%, while in the U.K. the FTSE Banks was up 23.8%. In the United States, the S&P Financials Index was up 14.8%. However, in the United States as well, the regional banks were among the few exceptions and the S&P Regional Banks index fell by 12.2%.
BBVA closes the year with greater progress than the banking indices
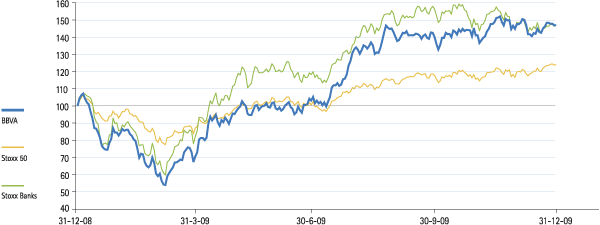
In this positive stock market environment, the performance of BBVA share in 2009 has been far superior to that of the sector as a whole, with a growth over the year of 47.0%.
The BBVA earnings figures presented over 2009 have, in general, been favorably received by analysts. This is especially true for the net interest income and cost reduction efforts, which evolved in excess of expectations. Overall, analysts very positively valued the Group’s operating income, its strength and sustainability, and highlighted its sound capital levels and capacity to generate core capital organically.
BBVA is trading at an attractive discount as compared to the sector
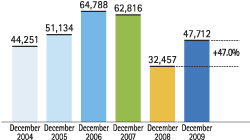
On December 31, 2009, the price of BBVA shares was €12.73, which represented a market capitalization of €47,712 million. At this price, the price/earnings ratio was 11.3, compared with 6.5 in December 2008 (both figures were calculated using the price and earnings at year-end). BBVA continues to be an attractive investment based on PER ratio compared with the European banking sector. BBVA traded at a 55% discount compared to the Stoxx Banks in Europe as at December 31, 2009, according to the analysis of the PER multiple estimated by the analyst consensus for the next 12 months. The BBVA PER is 9.36, compared with a 20.79 PER for Stoxx Banks. This gap has been maintained throughout the first months on 2010, with only slight changes.
The tangible book value per share, calculated by dividing the share capital net of goodwill by the number of shares, was €6.27 on December 31, 2009, 25.0% more than the €5.02 on the same date the previous year. The price/tangible book value is 2.0, compared with 1.7 in December 2008. The net attributable profit per share was €1.12 in 2009 (1.40 excluding one-offs), with an annual variation that is practically the same as the net attributable profit. The figure is relatively stable with respect to the level before the start of the crisis, while the majority of banks have seen their EPS suffer a significant drop in this period.
And offers attractive shareholder remuneration
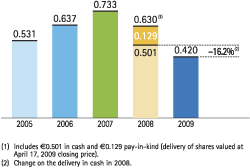
In terms of shareholder remuneration, against a background in which many banks have adjusted and even cancelled their cash remunerations, BBVA has distributed three interim dividends against 2009 earnings at a gross amount of €0.09 per share in cash. In addition, it will propose to the Annual General Meeting (AGM) the distribution of a final dividend of €0.15 per share, thus raising the total shareholder remuneration for 2009 to €0.42 per share, resulting in a 30% payout over the profit excluding one-offs and a yield per share of 3.3%.
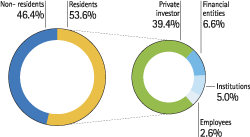
At the close of 2009, the number of shareholders in BBVA was 884,373, compared with 903,897 as of December 31, 2008, a slight fall (down 2.2%) reaching December 2007 levels. Capital ownership continues very diversified, as the only significant individual holding that BBVA is aware of is that of Mr. Manuel Jove Capellán, who as of December 31, 2009 held 4.34% of the share capital. It is worth highlighting that in 2009 shareholder dispersion was maintained, as of December 93.8% held fewer than 4,500 shares (compared with 93.9% as of December 31, 2008), representing 12.5% of the share capital (compared with 12.7% as of December 31, 2008). Average investment per shareholder was 4,238 shares, an average investment of €53,950 at the trading price as of December 31, 2009. A total of 53.6% of the share capital belongs to investors residing in Spain. In terms of type of shareholder, 39.4% of the share capital belongs to private investors, 2.6% to employees and the remaining 11.6% to institutional investors. Non-resident shareholders own 46.4% of the share capital, a slightly higher figure than in December 2008. This reflects the confidence in and recognition of the BBVA name in the international markets.
Banco Bilbao Vizcaya Argentaria, S.A. shares are traded on the continuous market in Spain, in the New York stock market (under ADS’s represented by ADR’s) and also on the London and Mexico stock markets.
Finally, BBVA shares continue to have a notably high level of liquidity. They have traded on each of the 254 days in the stock market year of 2009. A total of 13,299 million shares were traded on the stock exchange in this period, 354.8% of the share capital. Thus the daily average volume of traded shares was 52 million, 1.4% of the share capital and an effective daily average of €492 million. BBVA shares are included in the key indices Ibex 35 and Euro Stoxx 50, with a weighting of 11.78% in the former and 2.95% in the latter, and in several banking industry indices, most notably the Stoxx Banks, with a weight of 5.90%.