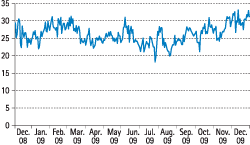
The Group’s market risk remains at low levels compared with the aggregates of risks managed by BBVA, particularly in terms of credit risk. This is due to the nature of the business and the Group’s policy of minimal proprietary trading. In 2009 the market risk of BBVA’s trading portfolio increased slightly on previous years to an average economic capital of €285 million.
There has been moderate use of global limits approved by the Executive Committee (the average was 49%), with a growing trend during the year in the case of Europe and a falling trend in America. The limits were not exceeded in any case.
The main risk factor in the Group continues to be linked to interest rates, with a weight of 58% of the total at the end of 2009 (this figure includes the spread risk). Volatility and FX risk accounted for 24% and 4% respectively, and lost weight compared with the same date the previous year. Finally, equity risk accounted for 14% of the total portfolio risk.
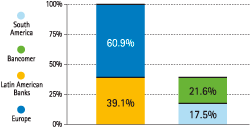
By geographical area, 61% of the market risk corresponded to Global Markets Europe trading desks and 39% to the Group’s banks in the Americas, of which 21.6% is in Mexico.
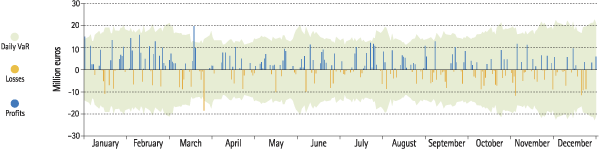
The backtesting comparison performed with market risk management results for the parent company (which accounts for most of the Group’s market risk) follows the principles set out in the Basel Accord. It makes a day-on-day comparison between actual risks and those estimated by the model, and proved once more that the risk measurement model was working correctly throughout 2009.
The average use of limits approved by the Executive Committee for the main business units has been higher in Europe and the United States, at around 55% over the year (66% as of December 31, 2009). In Latin America the average annual use was 44%, with a rise to close to 48% at year-end.