This area encompasses the banking and insurance business in the United States and in the Associate State of Puerto Rico.
The economic situation in the United States continued suffering generalized deterioration in 2009. In the first half of 2009, the United States. continued to show signs of being bogged down in a recession, with significantly lower levels of economic activity. However, third-quarter data already showed slight expansion: financial conditions were stabilizing, residential investment increased (for the first time since 2005), consumer spending picked up and business inventories were more in line with sales. In the last three months of the year, although the worst of the recession may have passed, the economy is still weak. The unemployment rate broke 10% for the first time since 1983, and many challenges lie ahead. As a result, we are anticipating low growth throughout 2010. The most significant hurdles to strong recovery will target personal consumption expenditure. While job destruction is slowing, it is still prevalent, and job creation will be minimal. Furthermore, despite indications that household demand is improving (steady increases in retail sales excluding autos and manufacturing activity), many households are still whittling down their debt. Credit standards remain high for those that seek it, such that credit outstanding in the market had dropped by more than US$100,000m in 2009. These factors will continue to constrain consumption in 2010, so overall recovery is likely to be slow.
Moderate growth in residential credit is expected. Low prices, attractive mortgage rates and the extension of the home buyers’ tax credit will support demand, which will prompt more construction. On the other hand, the deterioration of commercial real-estate fundamentals is eroding business investment in structures as credit is extremely limited. However, the negative impact to non-residential investment will be softened by further growth in the equipment and software component as businesses are motivated by cost-savings to replace technology.
Recent trends in international trade have shown that both domestic and foreign demand are recovering. While the latest data report growth in imports surpassing that of exports, the trend is expected to shift in the near future as recovery in emerging markets stimulates demand for exports.
Inflation is expected to remain low but positive. Although economic activity is increasing, it is emerging from a level so low that abundant resource slack will counteract upward pressures from fiscal and monetary stimuli. And as producers’ costs will remain low, they are able to maintain a profit without raising prices.
Given the slack in the economy, the Federal Reserve is expected to gradually wind down the monetary stimulus. The strategy is anticipated to focus first on the withdrawal of quantitative easing and then, albeit in the medium term, on raising interest rates. These are currently at between 0% and 0.25%.
The final dollar exchange rate against the euro has gone down 3.4% in the last twelve months, ending 2009 at US$1.44 to the euro. However, the average exchange rate recorded an appreciation of 5.4% year over year, to US$1.39 per euro. This indicates a negative exchange-rate effect on the balance sheet transactions and activity and a positive effect on the income statement. To get a clearer picture of real business performance in this context, all comments below will refer to year-on-year changes at a constant exchange rate unless otherwise indicated.
Another important event took place on August 22, 2009, when BBVA Compass bought some assets and liabilities of the financial institution Guaranty Financial Group (Guaranty) from the Federal Deposit Insurance Corporation (FDIC). This investment offers an attractive financial return, an opportunity to strengthen BBVA the United States’s banking franchise in the retail market (164 branches and 300,000 customers in Texas and California), while the agreement with the FDIC limits the credit risk to a minimum (the FDIC assumes 80% of the losses until the threshold of $2,285 million and 95% of the losses from this threshold). In addition, the purchase of Guaranty provides the Group with $7,500 million in loan portfolio and $11,400 million in customer funds.
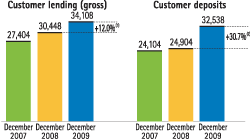
BBVA the United States closed 2009, with loans and receivables at €34,108 million, i.e. a 12.0% year-on-year increase thanks to the incorporation of Guaranty. Excluding Guaranty balances, loan balances were down 2.2% with a decrease in all categories except residential mortgages, which were up 7.6%.
Also, customer deposits have increased 30.7% on December 2008 to €32,538 million. Not counting the amount contributed by Guaranty, 4.1% growth was registered, particularly due to the increase in current accounts.
The area’s earnings for the year include two one-off charges booked to the fourth quarter for €1,050m. One was an extraordinary provision (€346 million) that allowed an increase in the coverage ratio, and the other is the impairment of goodwill (€704 million) generated in successive acquisitions to build the United States franchise.
These should shore up the United States franchise’s balance sheet and capital adequacy to prepare it for the complicated situation in 2010 and enable it to be ready to take advantage of any business and market opportunities.
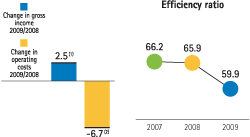
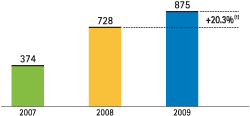
Operating income in 2009 speeded up its year-on-year growth to 20.3%, reaching €875m. The main causes were good revenue performance and the excellent behavior of operating costs. Net interest income showed a significant rise, triggered primarily by increasing business volumes following the incorporation of Guaranty’s balances. Net trading income also grew strongly, helped by more customer transactions and the higher value of some portfolios given the lower interest rates. This counteracted the drop in Other net income as Federal Deposit Insurance Corporation (FDIC) fees went up. Operating expenses decreased 6.7% in 2009 due to lower amortization of intangibles and lower merger and structural integration costs. As a result, efficiency (measured by the cost/income ratio) improved to 59.9%, as compared to the 65.9% in 2008.
Impairment losses on financial assets (net) stood at €1,419m, reflecting the high loan-loss provision allocations made during 2009. The collaterals associated to the commercial real-estate loan book were re-assessed, registering a write-off for the difference, and additional provisions were set aside to maintain coverage ratio compared to year end 2008. This, along with the goodwill impairment charge, generated a net attributable loss in the area of €1,071m. This figure is €21m excluding the €1,050m in one-offs.
Finally, the Group decided to carry out a subjective reclassification in the United States, declaring some loans that are currently performing as doubtful, for €644 million. This was the result of a detailed examination of the commercial real estate portfolios, as explained in the credit risk section of this report. This resulted in the NPA ratio increasing to 5.2%. Without the additional reclassification, the NPA ratios would stand at 4.0%. Coverage in the area remains at the same levels (57%) as at year-end 2008 thanks, in part, to the aforementioned higher provisions.