Logotype

Earnings

Throughout 2009, the BBVA Group’s earnings have sustained the following trends:

  • A strong net interest income through proper price and risk management.
  • Strict cost control, through the Transformation Plans implemented over the last several years and that continue to see results by way of year-on-year reductions in operating costs.
  • And an extremely dynamic operating income, which in the accumulated total for the year has grown 17.0% year-on-year, reaching a new high: €12,308 million. All of the business areas have positively contributed to the Group’s performance.
  • The above translates into a generalized improvement of the efficiency ratio, which improved from 44.6% as of December 31, 2008 to 40.4%, as at December 31, 2009.
  • Strengthening of the balance sheets of the Group and its franchises, for which a great effort has been made for additional provisioning for both early retirements and updating the value of the assets foreclosed or acquired in Spain.
  • Maintaining the high levels of organic generation of core capital, with 180 basis points more of core than in December of 2008.

Also, year-on-year comparisons of the BBVA Group’s earnings are affected by a series of one-offs:

  • In the third quarter of 2009, capital gains amounted to €830 million from the sale-andleaseback of 948 properties in Spain, were allocated to provisions in Spain and Portugal, with no effect on net attributable profit. In the fourth quarter, the one-off realized in the United States business unit for €1,050 million after tax, due to the impairment on goodwill and larger loan-loss provisioning to improve coverage and situate it at the same levels as at the close of 2008
  • In 2008, the one-off operations consume €395 million of the net attributable profit: €509 million in capital gains for the sale of its stake in Bradesco, less €602 million for the extraordinary provisioning for early retirements and €302 million for the provision stemming from the Madoff fraud.

When analyzing the figures, the effect of the variation of the average exchange rates in 2009 and 2008 must be considered, which is negative by nearly five percentage points. As usual, the accumulated income statement includes a column with the variation rates at a constant exchange rate.

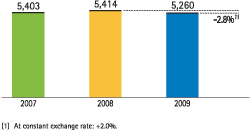
For 2009, the net attributed profit excluding one-offs was €5,260 million, for a slight decrease of 2.8% from the €5,414 million recorded in 2008. At constant exchange rates, the year-on-year is positive, at 2.0%.

Earnings’ growth for the Group is organic, as changes in the perimeter, mainly due to the incorporation of Guaranty in August 2009, have had no significant impact on net attributable profit.

The Group’s average total assets (ATA) have grown by 4.8% in 2009, due to the organic evolution of the business, despite the global slowdown of the economy during the year, which has had negative impacts on the evolution of banking activity. The headings that reflect the Group’s most recurrent income maintain high performance indices on the assets managed. Thus, the interest income on ATA rises to 2.56%, above the 2.26% in 2008 and 2.09% in 2007. Operating costs decrease in 2009, significantly reducing their weight up to 1.54% (1.63% in 2008 and 1.70% in 2007). This positive evolution of income and expenses is accompanied by an increase of the operating income over ATA to 2.27% in 2009, higher than in 2008 (2.03%) and 2007 (2.05%). Finally, the ROA (net income on ATA) is 0.85% and is affected by the aforementioned one-offs, without which it would be at 1.04%, versus the 1.12% in 2008 and 1.23% in 2007.

Consolidated income statement

Download


2009 D% ∆% at constant exchange rates 2008 2007
Net interest income 13,882 18.8 23.4 11,686 9,628
Net fees and commissions 4,430 (2.1) 1.0 4,527 4,559
Net trading income 1,544 (0.9) 2.5 1,558 1,956
Dividend income 443 (0.9) (1.1) 447 348
Income by the equity method 120 (59.1) (59.0) 293 242
Other operating income and expenses 248 (46.9) (43.9) 466 538
Gross income 20,666 8.9 12.8 18,978 17,271
Operating costs (8,358) (1.1) 1.2 (8,455) (7,830)
Personnel expenses (4,651) (1.4) 0.6 (4,716) (4,335)
General and administrative expenses (3,011) (1.0) 2.6 (3,040) (2,918)
Depreciation and amortization (697) (0.3) (0.8) (699) (577)
Operating income 12,308 17.0 22.3 10,523 9,441
Impairment on financial assets (net) (5,473) 86.1 94.7 (2,940) (1,903)
Provisions (net) (458) (68.0) (67.8) (1,431) (235)
Other gains (losses) (641) n.m. n.m. 775 1,191
Income before tax 5,736 (17.2) (13.1) 6,926 8,495
Income tax (1,141) (26.0) (22.3) (1,541) (2,080)
Net income 4,595 (14.7) (10.5) 5,385 6,415
Minority interests (385) 5.2 3.7 (366) (289)
Net attributable profit 4,210 (16.1) (11.6) 5,020 6,126
Net one-offs¹ (1,050) n.m. n.m. (395) 724
Net attributable profit (excluding one-offs) 5,260 (2.8) 2.0 5,414 5,403
Earnings per share calculation


Basic earnings per share (euros) 1.12 (17.0)
1.35 1.70
Basic earnings per share excluding one-offs (euros) 1.40 (3.9)
1.46 1.50
¹ In the third quarter of 2009, capital gains on the sale-and-lease-back of properties which have been allotted to generic provisions for NPLs with no effect on net attributable profit. In the fourth quarter the extraordinary allocation to provisions and the goodwill impairment, both in the US. In 2008, capital gains from Bradesco in the first quarter, provisions for non-recurrent early retirements in the second and fourth quarters and provision for the loss originated by the Madoff fraud in the fourth quarter.

Consolidated income statement: quarterly evolution

Download


2009 2008

4Q 3Q 2Q 1Q 4Q 3Q 2Q 1Q
Net interest income 3,589 3,434 3,586 3,272 3,088 3,043 2,829 2,726
Net fees and commissions 1,163 1,086 1,102 1,079 1,105 1,138 1,153 1,131
Net trading income 420 325 435 364 139 260 568 591
Dividend income 153 42 207 41 45 161 186 56
Income by the equity method 114 (21) 22 4 25 95 34 139
Other operating income and expenses (151) 130 140 129 157 96 83 130
Gross income 5,288 4,998 5,491 4,889 4,558 4,794 4,854 4,772
Operating costs (2,254) (2,017) (2,017) (2,070) (2,203) (2,099) (2,069) (2,084)
Personnel expenses (1,233) (1,127) (1,130) (1,161) (1,188) (1,185) (1,165) (1,178)
General and administrative expenses (852) (716) (709) (734) (827) (740) (743) (730)
Depreciation and amortization (169) (174) (178) (175) (187) (174) (161) (177)
Operating income 3,034 2,981 3,474 2,819 2,355 2,695 2,784 2,688
Impairment on financial assets (net) (1,787) (1,741) (1,029) (916) (859) (917) (607) (557)
Provisions (net) (224) (82) (48) (104) (837) 18 (467) (145)
Other gains (losses) (1,238) 789 (228) 36 (30) 11 (2) 796
Income before tax (214) 1,947 2,168 1,834 629 1,807 1,708 2,783
Income tax 277 (457) (480) (480) (12) (316) (476) (738)
Net income 63 1,490 1,688 1,354 617 1,491 1,232 2,045
Minority interests (31) (110) (127) (116) (98) (99) (75) (94)
Net attributable profit 31 1,380 1,561 1,238 519 1,392 1,157 1,951
Net one-offs¹ (1,050) - - - (575) - (329) 509
Net attributable profit (excluding one-offs) 1,082 1,380 1,561 1,238 1,094 1,392 1,486 1,442
Earnings per share


Basic earnings per share (euros) 0.01 0.37 0.42 0.34 0.14 0.38 0.31 0.53
Basic earnings per share excluding one-offs (euros) 0.29 0.37 0.42 0.34 0.30 0.38 0.40 0.39
¹ In the third quarter of 2009, capital gains on the sale-and-lease-back of properties which have been allotted to generic provisions for NPLs with no effect on net attributable profit. In the fourth quarter the extraordinary allocation to provisions and the goodwill impairment, both in the US. In 2008, capital gains from Bradesco in the first quarter, provisions for non-recurrent early retirements in the second and fourth quarters and provision for the loss originated by the Madoff fraud in the fourth quarter.

Net attributable profit excluding one-offs

(Million euros)

Net attributable profit excluding one-offs

Consolidated income statement: percentage of ATA

Download


2009 2008 2007
Net interest income 2.56 2.26 2.09
Net fees and commissions 0.82 0.87 0.99
Net trading income 0.28 0.30 0.42
Other operating income and expenses 0.15 0.23 0.24
Gross income 3.81 3.66 3.74
Operating costs (1.54) (1.63) (1.70)
Personnel expenses (0.86) (0.91) (0.94)
General and administrative expenses (0.55) (0.59) (0.63)
   Depreciation and amortization (0.13) (0.13) (0.13)
Operating income 2.27 2.03 2.05
Impairment on financial assets (net) (1.01) (0.57) (0.41)
Provisions (net) and other gains (losses) (0.20) (0.13) 0.21
Income before tax 1.06 1.34 1.84
Income tax (0.21) (0.30) (0.45)
Net income (ROA) 0.85 1.04 1.39
Net income (excluding one-offs)


(ROA excluding one-offs)" 1.04 1.12 1.23
Minority interests (0.07) (0.07) (0.06)
Net attributable profit 0.78 0.97 1.33
Net attributable profIT (excluding one-offs) 0.97 1.05 1.17
Memorandum item:


Average total assets (million euros) 542,969 517,856 461,199
Tools