(Consolidated figures)
|
|
31-12-09 | D% | 31-12-08 | 31-12-07 |
|---|---|---|---|---|
| Balance sheet (million euros) |
|
|
|
|
| Total assets | 535,065 | (1.4) | 542,650 | 501,726 |
| Total lending (gross) | 332,162 | (3.1) | 342,682 | 320,311 |
| Customer funds on balance sheet | 371,999 | (1.2) | 376,380 | 337,518 |
| Other customer funds | 136,957 | 15.1 | 119,017 | 150,777 |
| Total customer funds | 508,957 | 2.7 | 495,397 | 488,295 |
| Total equity | 30,763 | 15.2 | 26,705 | 27,943 |
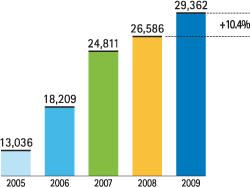
| Stockholders' funds | 29,362 | 10.4 | 26,586 | 24,811 |
| Income statement (million euros) |
|
|
|
|
| Net interest income | 13,882 | 18.8 | 11,686 | 9,628 |
| Gross income | 20,666 | 8.9 | 18,978 | 17,271 |
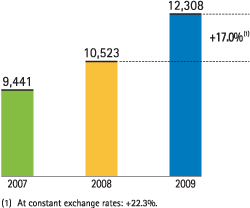
| Operating income | 12,308 | 17.0 | 10,523 | 9,441 |
| Income before tax | 5,736 | (17.2) | 6,926 | 8,495 |
| Net attributable profit | 4,210 | (16.1) | 5,020 | 6,126 |
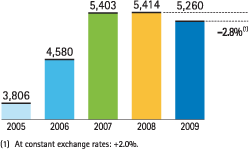
| Net attributable profit excluding one-offs¹ | 5,260 | (2.8) | 5,414 | 5,403 |
| Data per share and share performance ratios |
|
|
|
|
| Share price (euros) | 12.73 | 47.0 | 8.66 | 16.76 |
| Market capitalization (million euros) | 47,712 | 47.0 | 32,457 | 62,816 |
| Net attributable profit per share (euros) | 1.12 | (17.0) | 1.35 | 1.70 |
| Net attributable profit per share excluding one-off operations (euros)¹ | 1.40 | (3.9) | 1.46 | 1.50 |
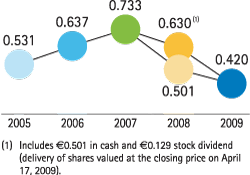
| Dividend per share (euros)² | 0.42 | (42.7) | 0.63 | 0.73 |
| Book value per share (euros) | 7.83 | 10.4 | 7.09 | 6.62 |
| Tangible book value per share (euros)³ | 6.27 | 25.0 | 5.02 | 5.44 |
| P/BV (Price/book value; times) | 1.6 |
|
1.2 | 2.5 |
| Price/tangible book value (times)³ | 2.0 |
|
1.7 | 3.1 |
| PER (Price/Earnings; times) | 11.3 |
|
6.5 | 10.3 |
| Yield (Dividend/Price; %)² | 3.3 |
|
7.3 | 4.4 |
| Significant ratios (%) |
|
|
|
|
| ROE (Net attributable profit/Average equity) | 16.0 |
|
21.5 | 34.2 |
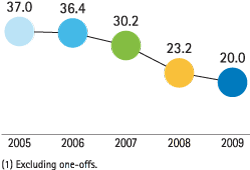
| ROE excluding one-off operations¹ | 20.0 |
|
23.2 | 30.2 |
| ROA (Net income/Average total assets) | 0.85 |
|
1.04 | 1.39 |
| ROA excluding one-off operations¹ | 1.04 |
|
1.12 | 1.23 |
| RORWA (Net income/Average risk-weighted assets) | 1.56 |
|
1.94 | 2.39 |
| RORWA excluding one-off operations¹ | 1.92 |
|
2.08 | 2.12 |
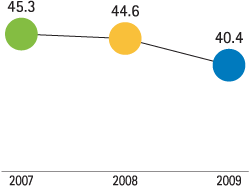
| Efficiency ratio | 40.4 |
|
44.6 | 45.3 |
| Risk premium excluding one-off operations¹ | 1.15 |
|
0.82 | 0.60 |
| NPA ratio | 4.3 |
|
2.3 | 1.0 |
| NPA coverage ratio | 57 |
|
92 | 225 |
| Capital adequacy ratios (%) |
|
|
|
|
| BIS Ratio | 13.6 |
|
12.2 | 13.4 |
| Core capital | 8.0 |
|
6.2 | 6.2 |
| Tier I | 9.4 |
|
7.9 | 7.7 |
| Other information |
|
|
|
|
| Number of shares (millions) | 3,748 |
|
3,748 | 3,748 |
| Number of shareholders | 884,373 |
|
903,897 | 889,734 |
| Number of employees | 103,721 |
|
108,972 | 111,913 |
| Number of branches | 7,466 |
|
7,787 | 8,028 |
| Number of ATMs | 19,279 |
|
18,194 | 16,808 |