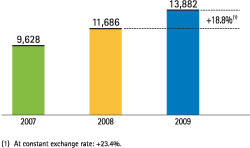
In 2009, the net interest income has continued to be the primary driver for the Group’s income, now at a new historic high of €13,882 million, with an 18.8% growth as compared to the same date the previous year (+23.4% without the effect of exchange rates).
This growth is due, in part, to the active pricing policy in the business units and the proper management of structural risks on the balance sheet.
Price management in all business areas has enabled comfortable compensation for the growth in impaired assets and the slowdown of banking activity. This management has been centered on three factors, which have given rise to an improvement of the spread: asset repricing to reflect increased risks while containing funding costs, selecting the products and segments with the best risk-adjusted return on economic capital and optimizing the structure of funding.
Management of structural risks for interest and liquidity has been characterized by anticipation and several strict criteria for prudence. This has allowed for the generation of a solid balance sheet, with low leverage and a reduced risk profile. On the one hand, portfolios have been constructed to enable the stabilization of the evolution of the net interest income and economic value of the balance sheet, and on the other, significant growth of loan portfolio in previous years has been financed with a proper funding structure for terms, instruments and diversification.
As regards business with clients in the euro zone, the drop in interest rates had, at first, a positive effect due to the slower decrease in assets return (the majority being mortgages) than the cost of funding, an effect that has been diluting throughout the year as assets are re-priced. In 2009, this decrease of rates has impacted both the asset repricing (down 1.81 percentage points to 4.17%) and the funding costs (down 1.80 percentage points to 1.14%). Thus, the customer spread is stable for the year, at 3.03% in 2009 (3.04% in 2008). Furthermore, it must be emphasized that this implies a lower risk level in the balance sheet due to the decreased weight of consumer portfolios and for the increase of low-cost funding sources. This spread is compatible with an increase of net interest income of 3.2% year-on-year in Spain and Portugal and in the Wholesale Banking & Asset Management (WB&AM) units operating in the euro zone. Another relevant measure of profitability is the interest income over average total assets (ATA), that advanced in 2009 for the Group to 2.56%, as compared to the 2.26% in 2008, and improves over the year in all domestic units (retail businesses and Corporate and Business Banking).
In Mexico, interbank interest rates experienced a sharp fall in the first part of the year, with the average TIIE at 5.9% as compared to the 8.3% in 2008. This decrease has carried over to the cost of deposits, which decreased 0.69 percentage points to 2.37%, and the return on assets which is also affected by the change in the business mix, with less weight on consumer finance and credit cards. These two motives have caused it to fall back 1.42 percentage points in 2009 as compared to 2008. As a result, the customer spread decreases to 11.64% versus the 12.38% in 2008.
In the United States, the net interest income rose by 7.8% year-on-year in 2009 in the local currency, primarily sustained by an increase in activity due fundamentally to the incorporation of Guaranty and the repricing efforts carried out during the year.
Finally, South America once again presented a positive performance in net interest income with an increase of 15.2% as compared to 2008 at constant exchange rates. This evolution is based on increased volumes of resources, sustained credit volume and a good level of spreads.