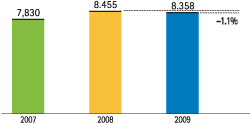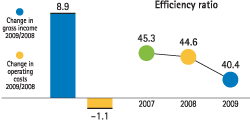
During the entire year operating costs continued their containment trend that started at the beginning of 2008. They came to €8,358m, which was €97m less than 2008, thanks to BBVA’s ability to anticipate the present crisis by implementing several Transformation Plans as far back as 2006. The Spain and Portugal area made a significant effort to contain its costs, which fell 4.2% during the year. In the Americas operating costs were held at the same levels as a year earlier (at constant exchange rates), taking into consideration the levels of inflation in the area.
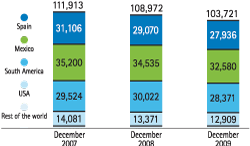
The BBVA Group’s workforce as at December 31, 2009 stood at 103,721 people, after a 4.8% decrease on 2008. The main variations in the year appeared in the United States, with a regularization in the first quarter that was partially compensated for by the incorporation of Guaranty in the third quarter.
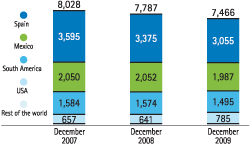
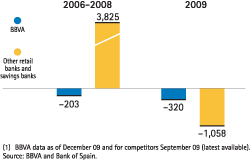
The branch network as at December 31, 2009 was at 7,466 branches, 321 fewer than in December 31, 2008 due to the continued streamlining of the distribution networks. In Spain, this decrease has been ongoing since 2006, meaning that BBVA was ahead of the sector trend by two years.
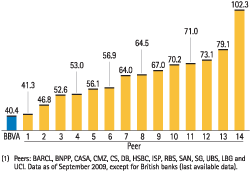
The efficiency ratio shows improvement on the previous year, both due to the growth of income and the contention of expenses, and stands at 40.4% in 2009, as compared to the 44.6% in 2008. This level maintains BBVA as one of the most efficient banks within its reference group.
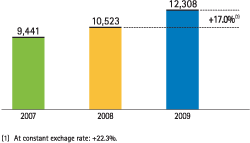
Hence, the operating income for the year 2009 was €12,308 million, for a 17.0% increase over the €10,523 million recorded in 2008 (+22.3% without the effect of the exchange rates).
All business areas contribute positively to this marked evolution of the operating income, with contributions reaching: €4,533 million in Spain and Portugal, €1,386 million in WB&AM, €3,319 million in Mexico, €875 million in United States and €2,202 million in South America.