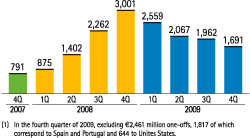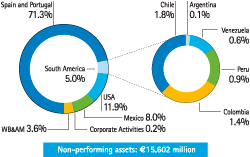
The deterioration of the economic situation continued in 2009, with no end to the uncertainty regarding the duration and depth of the crisis that began in 2007. Thus, at the close of 2009, the BBVA Group made an effort to strengthen its balance sheet performing a detailed analysis of its portfolios using criteria of maximum prudence to reflect any possibilities of impairments in the forthcoming months. This will allow the Group to face the complicated environment expected for 2010 in better shape, while taking advantages of any business opportunities that may arise. The total amount of non-performing loans was €15,602 million in December 2009, compared with €8,568 million in 2008, of which €2,461 million represent subjective reclassifications in the fourth quarter of 2009 in the areas of Spain and Portugal (€1,817 million affecting the real estate development portfolio) and in the United States (€644 affecting the commercial real estate portfolio).
The adjoining tables show the changes in the period January 1 to December 31, 2009 for non-performing customer loans and doubtful contingent liabilities, both for the BBVA Group as a whole and for each business area.
The net increase of €3,200 million can be partly explained by the proactive policy mentioned above in the areas of Spain and Portugal and the United States. If these one-off impacts are not taken into account, the trend of a quarterly reduction in the net entry and the improvement in the recovery ratio, both in the Group as a whole and in Spain and Portugal, would consolidate.
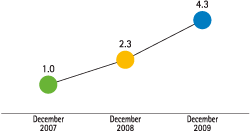
The Group’s non-performing assets ratio stood at 4.3%, compared with 2.3% in December 2008. This can be explained in part by the non-performing increases mentioned above. In Spain and Portugal, this rate was 5.1%, which would be 4.3% not counting the reclassifications. The figure for asset purchases from companies in difficulties was extremely limited, particularly in the second quarter, at €776 million for the whole year (€629 million in 2008). In the United States, the non-performing was 5.2%, in Mexico 4.3%, South America 2.7% and in WB&AM, 1.0%.
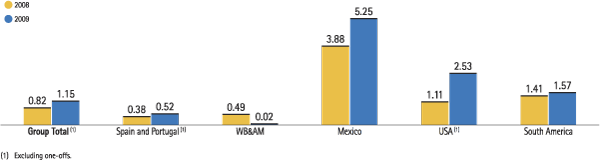
The Group’s risk premium, which measures the charge against earnings made for net loss provisioning per lending unit, rose 33 basis points in 2009 to 1.15% (excluding one-offs) compared with 0.82% in 2008. By business area, Mexico increased by 137 basis points to 5.25% and the United States by 142 to 2.53% (excluding one-offs), while in Spain and Portugal and South America the rise was limited to 14 and 16 basis points to 0.52% (excluding one-offs) and 1.57%, respectively.
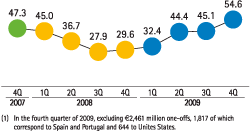
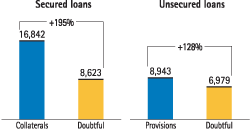
Provisioning for insolvency risk in the customer lending portfolio increased by 14.1% to €8,943 million. Of this amount, generic and country risk reserves accounted for €2,975 million, 33.3% of the reserves overall. The Group’s coverage ratio stood at 57%, or 165% taking into account the collateral associated with the non-performing loan portfolio. The value of this collateral is 195% of the balance of secured doubtful loans. Provisions covered 128% of the unsecured non-performing loans.