The Spain and Portugal area provides a distinctly different and innovative approach to banking through specialized branch networks and handles the financial and non-financial needs of individual customers (Spanish Retail Network), including the upper-middle market segment (BBVA Patrimonios). The area also includes Corporate and Business Banking (CBB) for managing SMEs, corporations and public and private institutions and other specialized units which handle consumer finance and internet banking (the Consumer Finance Unit), the bancassurance business and BBVA Portugal.
In 2009, the domestic market reported asymmetric behavior. On the one hand, the contraction of internal demand has led to a fall in lending activity volumes, especially in consumer finance loans and corporate financing. Furthermore, the progressive increase in Spain’s savings rate has resulted in dynamism in fund gathering, especially for the more conservative, low cost types (bonds and guaranteed mutual funds, etc.) to the detriment of time deposits.
In this environment, the area has continued applying its differential commercial management model: focus on the client, commitment to society, containing costs and controlling risk. In 2009, this model has allowed the area to lead in the support of families and small enterprises with the launch of several loan and savings campaigns adapted to these customers’ needs, among others. These initiatives were made possible by the Group’s financial strength, ample liquidity and superior risk management.
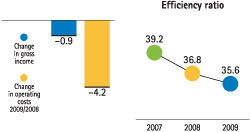
At December 31, 2009 gross lending to customers stood at €204,351m, a slight decline compared to €206,896m a year earlier, reflecting the global economic slowdown and the smaller percentage of loans in those sectors and products with greater risk. Customer funds under management (deposits, mutual and pension funds plus the distribution of BBVA bonds) fell 4.6% to €141,316m year-on-year. The main reason behind the decrease was the lower demand for time deposits, which is associated with the progressive fall of the official interest rates. As at December 31, 2009, their balance stood at €32,005 million, 22.7% lower than at December 31, 2008. However, the capture of paychecks and pension funds, and BBVA’s leadership in the corporate segment, have implied a year-on-year increase of 5.5%, to €42,172 million, in transactional liabilities, an increase of 8.2% in the subscriptions to money market and short-term fixed-income funds, and the placement of €2,000m of BBVA bonds during the year.
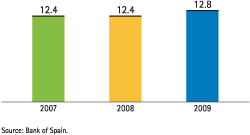
In a year in which GDP falls, net interest income, €4,934 million increased 2.7%. In terms of average total assets, the area’s profitability at December 31, 2009 rose by 2.25% (2.16% in 2008) as a result of appropriate pricing and gains in market share in 2009: BBVA gained 41 basis points of market share in household mortgages (bringing the total to 12.8%), and 40 basis points in public sector finance (33.1%). At the end of 2009, BBVA was also the leader (according to an FRS report) in the SME and large-company segment and in assets under management in mutual and pension funds (19.3% and 18.6%, respectively). Net fees and commissions income for the year was €1,482m, down 9.4% on lower fee revenues from mutual funds and despite a 1.4% rise in fees and commissions for banking services. The insurance business also made a notable contribution with net income rising 9.3% in the year.
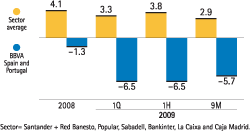
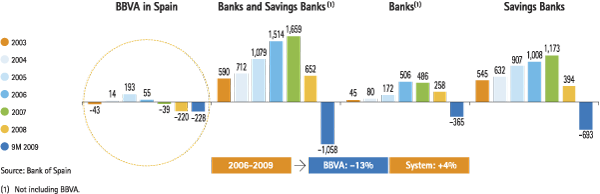
The area achieved a significant reduction in operating costs, which fell 4.2% during the year thanks to the Transformation Plan launched in 2006. Since 2007 the plan has reduced costs by 5.4%, lowered the number of branches by 540 and employees by 3,170. In the same period, the rest of the Spanish banking sector (excluding BBVA) added 1,253 branches and 21,531 employees according to the latest available figures (September 2009 and year-end 2008, respectively).
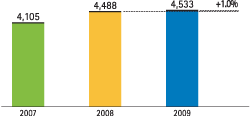
The improvements in income and costs lifted operating income 1.0% to €4,533m for the year. Such improvements were achieved despite the complex macroeconomic environment and a drop in revenues associated with financial markets (net trading income was down 18.8%). The area closed the year with a new improvement in efficiency (cost/income ratio), which stands at 35.6% (36.8% in 2008).
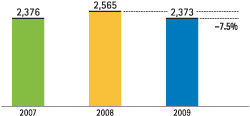
One priority of the area in 2009 was to strengthen its balance sheet to increase its ability to tackle the complex conditions expected in 2010. It therefore made an important effort in terms of provisioning that resulted in accumulated impairment losses on financial assets of €1,931m (€809m in 2008). Consequently, net attributable profit fell 7.5% in the year to €2,373 million.
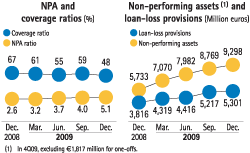
The strict risk controls raised the non-performing asset ratio to 5.1% after an extraordinary downgrade in the fourth quarter affecting €1,817m of such assets. The aim is to anticipate those situations that might deteriorate in the coming months by applying extremely prudent criteria. Excluding this effect, the NPA stands at 4.3%, gross additions to NPA status fall 26.9% in the year and debt recovery was up 62.4%. The coverage ratio stands at 48%.