Logotype

South America


The South America area manages the BBVA Group’s banking, pension and insurance businesses in the region.

The international financial crisis had a less negative effect on Latin America than expected, and clear signs of economic recovery were observed in the second quarter. Unlike previous crises, on this occasion the vast majority of countries in the region have adopted a significant expansive bias in their economic policies without provoking imbalances that would put this recovery in danger. Increasingly sound public finances, controlled inflation, the credibility that central banks have gained and the greater flexibility of the forex markets have been fundamental factors in the region’s improved performance. Stronger commodity prices and lower risk aversion have also contributed to the recovery. The rise in commodity prices took some pressure off the countries with most limited access to international credit, such as Argentina and Venezuela. The financial systems in the region showed enormous strength. They were able to weather the tight access to international funding at the end of 2008. They appeared unscathed by the decrease in the dynamism of activity and the increase in NPA ratios at the beginning of the year, which were anyway not as intense as elsewhere in the world or as in other crises.

There were no significant differences in exchange rates in the last part of the year, as compared to the US dollar. In comparison with the annual evolution of the euro, there was a slightly negative exchange-rate effect on the income statement and a positive effect on the balance sheet transactions and activity. As usual, the attached tables include columns with the year-on-year changes at constant exchange rates, which is what the following comments refer to. The sale of the Group’s stake in the insurance company Consolidar Salud and the nationalization of the pension fund business in Argentina in the fourth quarter of 2008 must be taken into account when analyzing year-on-year variations.

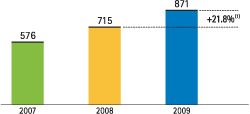
During a difficult year, the area performed well. There was a significant growth in revenues; costs were gradually moderated and a comfortable level of asset quality was maintained. All this fed into an €871m net attributable profit in 2009. This was up 21.8% year-on-year, sustaining a high level of return on equity (ROE): 40.2%.

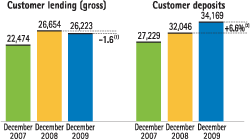
This excellent performance of income has been due to the correct pricing policy and the improved spreads applied, which are fundamental factors to offset the slight decrease in credit activity which ended December down 1.6% year-on-year at €26,223 million. Decreased financing needs stemming from the slowdown of loans have allowed for the implementation of a selective marketing policy for customer funds, giving priority to low-cost modalities. At the end of December, customer funds showed a balance of €34,169m (including mutual funds), 6.6% higher than in December 2008. Growth was largely concentrated in current and savings accounts (up 19.7%). The assets managed by pension fund managers were up 27.6% year-on-year to €36,104m.

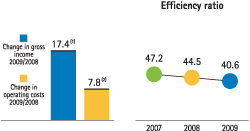
Therefore, the net interest income for 2009 was €2,463 million, for a 15.2% growth year-on-year. It was also a good year for fees and commissions, which were up 9.6% at €836 million. The more traditional lines of business did well and those related to mutual funds and securities improved in the later quarters of 2009. Net trading income stood at €405m, reflecting a positive year on the financial markets. The sale of financial instruments in the banking business generated capital gains and the pension managers and insurance companies reported high returns from proprietary trading. Year-to-end gross income in 2009 reached €3,706m, up 17.4% on the previous year.

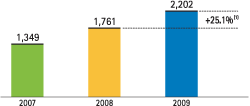
Austerity measures and correct cost management have been key factors during the year. Operating costs were €1,504m. This was 7.8% higher than the previous year and substantially below the average regional inflation rate. This moderation in expenses and positive revenue growth meant that, as in previous years, the cost-income ratio improved, reaching 40.6% as against the 44.5% reported in 2008. Operating income rose 25.1% over the year, to €2,202m.

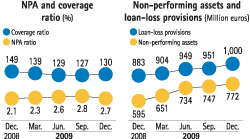
The third characteristic marking the year was the strict policy applied to risk acceptance and the success of the recoveries policy implemented by the area’s units. This considerably curtailed the impact of the crisis on asset quality. Thus, the 2.7% year-end NPA ratio remained quite close to the 2.1% reported in 2008. Coverage remained high, at 130%. In 2009, losses from impairments on financial assets grew 17.6% year-on-year to €419m.

BBVA footprint in South America¹

Banks Pension fund managers Insurance companies
Argentina
Bolivia

Chile
Colombia
Ecuador

Panama

Paraguay

Peru
Uruguay

Venezuela
¹ Data as at December 31, 2009.

South America. Net attributable profit

(Million euros at constant exchange rate)

South America. Net attributable profit
¹ At current exchange rate: +19.8%

South America

(Million euros at constant exchange rate)

South America
¹ At current exchange rate: +3.8% ² At current exchange rate: +11.4%

Income statement

(Million euros)

Download


Units:

South America Banking Business Pensions and Insurance

2009 ∆% ∆%¹ 2008 2007 2009 ∆% ∆%¹ 2008 2009 ∆% ∆%¹ 2008
Net interest income 2,463 14.6 15.2 2,149 1,746 2,421 17.8 18.0 2,056 45 (52.9) (50.1) 96
Net fees and commissions 836 7.8 9.6 775 751 625 11.1 12.9 562 215 0.6 2.3 214
Net trading income 405 60.4 65.5 253 222 282 7.5 9.6 263 124 n.m. n.m. (9)
Other income/expenses 2 (83.3) (73.7) 15 (19) (97) 72.4 70.5 (56) 109 38.4 48.1 79
Gross income 3,706 16.1 17.4 3,192 2,701 3,230 14.4 15.2 2,824 493 29.8 35.7 380
Operating costs (1,504) 5.8 7.8 (1,421) (1,274) (1,260) 10.2 11.7 (1,143) (223) (10.5) (6.3) (250)
Personnel expenses (768) 5.9 8.1 (725) (650) (634) 10.6 12.3 (574) (111) (13.9) (9.8) (129)
General and administrative expenses (621) 5.4 7.5 (589) (531) (522) 10.6 12.2 (472) (101) (9.5) (5.2) (112)
Depreciation and amortization (115) 7.8 8.0 (107) (93) (104) 6.1 6.1 (98) (11) 25.7 29.7 (9)
Operating income 2,202 24.4 25.1 1,770 1,427 1,970 17.2 17.5 1,681 269 107.1 116.4 130
Impairment on financial assets (net) (419) 17.3 17.6 (358) (262) (415) 16.1 16.4 (358) (4) n.m. n.m. -
Provisions (net) and other gains (losses) (52) 206.0 175.4 (17) (63) (24) 79.2 59.8 (13) (16) n.m. n.m. (4)
Income before tax 1,731 24.0 24.9 1,396 1,102 1,531 16.8 17.3 1,310 249 97.1 106.7 126
Income tax (397) 24.9 26.6 (318) (197) (356) 24.5 25.2 (286) (56) 27.3 35.4 (44)
Net income 1,334 23.7 24.5 1,078 905 1,175 14.7 15.1 1,024 193 134.9 144.3 82
Minority interests (463) 31.9 29.7 (351) (282) (406) 21.0 18.9 (335) (58) 281.4 281.5 (15)
Net attributable profit 871 19.8 21.8 727 623 769 11.7 13.1 689 135 101.5 111.5 67
¹ At constant exchange rate.

Balance sheet

(Million euros)

Download


31-12-09 ∆% ∆%¹ 31-12-08 31-12-07 31-12-09 ∆% ∆%¹ 31-12-08 31-12-09 ∆% ∆%¹ 31-12-08
Cash and balances with central banks 5,837 5.9 6.7 5,512 4,016 5,837 5.9 6.7 5,511 - - - -
Financial assets 7,688 31.3 21.6 5,854 4,546 6,335 25.5 15.7 5,046 1,962 91.0 79.6 1,027
Loans and receivables 28,269 1.6 (3.3) 27,836 24,016 27,793 2.0 (2.9) 27,235 615 (18.1) (19.9) 751
–  Loans and advances to customers 25,256 3.5 (1.9) 24,405 21,676 25,041 3.6 (1.9) 24,159 238 (17.6) (14.0) 289
–  Loans and advances to credit institutions and other 3,013 (12.2) (13.7) 3,430 2,340 2,752 (10.5) (11.3) 3,076 377 (18.4) (23.3) 462
Tangible assets 648 35.7 31.1 478 457 600 40.4 36.9 427 49 (2.8) (13.4) 50
Other assets 1,936 0.7 (2.7) 1,922 1,652 1,325 6.2 0.7 1,248 150 14.6 12.1 131
Total assets/liabilities and equity 44,378 6.7 2.0 41,600 34,687 41,889 6.1 1.3 39,467 2,776 41.7 35.3 1,960
Deposits from central banks and credit institutions 3,092 (15.8) (21.7) 3,674 2,763 3,086 (15.8) (21.7) 3,667 12 38.8 36.2 8
Deposits from customers 29,312 5.0 1.1 27,921 24,018 29,427 5.0 1.2 28,028 - - - -
Debt certificates 1,554 25.1 9.9 1,243 870 1,554 25.1 9.9 1,243 - - - -
Subordinated liabilities 1,229 (0.9) (6.7) 1,240 1,137 733 7.7 (3.3) 680 - - - -
Financial liabilities held for trading 680 (32.3) (43.1) 1,005 371 680 (32.3) (43.1) 1,005 - - - -
Other liabilities 6,160 42.7 40.1 4,316 3,507 4,613 39.1 37.9 3,317 2,211 73.6 62.2 1,273
Economic capital allocated 2,350 6.8 3.7 2,201 2,021 1,796 17.6 13.0 1,527 554 (18.3) (18.6) 678
¹ At constant exchange rate.

Relevant business indicators

Download


South America

31-12-09 ∆% ∆%¹ 31-12-08 31-12-07
Customer lending (gross) 26,223 3.8 (1.6) 25,255 22,434
Customer deposits² 31,529 7.3 3.0 29,373 25,530
Off-balance-sheet funds 38,744 50.0 30.4 25,831 36,551
–  Mutual funds 2,640 103.0 85.4 1,300 1,725
–  Pension funds 36,104 47.2 27.6 24,531 34,826
ROE (%) 40.2

36.9 33.4
Efficiency ratio (%) 40.6

44.5 47.2
NPA ratio (%) 2.7

2.1 2.1
Coverage ratio (%) 130

149 148
¹ At constant exchange rate. ² Including debt certificates.

South America. Efficiency ratio

(Percentage)

South America. Efficiency ratio
¹ At current exchange rate: +16.1%. ² At current exchange rate: +5.8%

South America. Operating income

(Million euros at constant exchange rate)

South America. Operating income
¹ At current exchange rate: +24.4%.

South America

South America
Tools