We closed 2009 as a 'better bank'
Sound operating result
- Net interest income
(Million euros) -
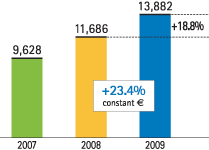
- A strong net interest income through a proper price management and improved funding mix
- Gross income
(Million euros) -
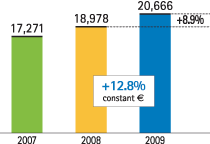
- Good performance of gross income
- Operating costs
(Million euros) -
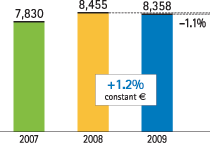
- Strict cost control
- Total income/costs
Accrued earnings (base 100 = 2007) -
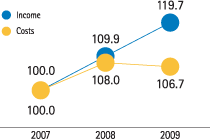
- Efficiency ratio
(Percentage) -
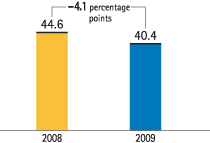
Resulting in overall improved efficiency
- Operating income
(Million euros) -
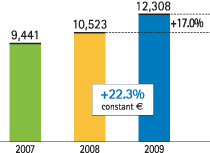
- And an extremely dynamic operating income
This allows a major effort to be made in provisioning
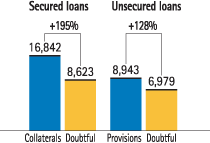
A high level of coverage for doubtful assets with provisions and collaterals
Recurrent earnings in a much more complex environment
- Operating income and provisions
(Million euros and number of times) -
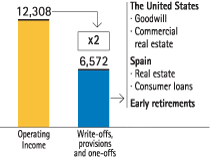
- Coverage including provisions and collaterals(Million euros)
-
- Group net attributable profit excluding one-offs(Million euros)
-
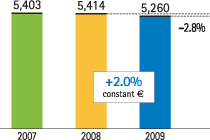
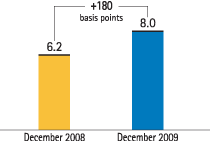
That result in closing 2009 better capitalized
And obtain an above-average total return for the shareholder
- Evolution of core capital
(Percentage) -
And maintain a cash dividend payment of 0.42 euros per share (a 30% payout on net attributable profit excluding one-offs)
- Total shareholder return
(Percentage) -
2009 2008-2009 2007-2009 2006-2009 BBVA +53.7% -8.1% -7.0% +0.2% Median for peers1 +29.2% -22.1% -21.8% -11.8%
