The Wholesale Banking & Asset Management (WB&AM) area handles the Group’s wholesale businesses and asset management. It is organized around three major units: Corporate and Investment Banking, Global Markets and Asset Management. Furthermore it includes the Industrial and Real Estate Holdings Unit, which contributes to its diversification, and the Group’s holdings in the CITIC financial group associated with expansion in Asia.
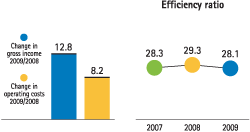
By the end of 2009 the area’s gross income rose 12.8% year-on-year. The increase was achieved despite lower revenues from portfolio divestments (down €193m compared to 2008). This was partially offset by income of €160m from China Citic Bank (CNCB). Gross income was supported by net interest income and net fees and commissions income, which increased 53.9% and 24.7%, respectively.
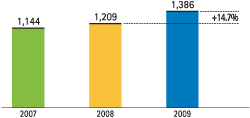
Operating costs were contained throughout 2009, rising more slowly year-on-year (up 8.2% compared to 10.8% in 2008). Efficiency stands at 28.1%, as compared to the 29.3% in 2008, and operating income totaled €1,386m for a 14.7% improvement on 2008.
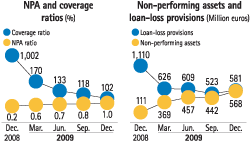
In terms of loan-loss provisions WB&AM continues to enjoy a high level of asset quality with a low non-performing asset ratio (1.0%) and a coverage ratio of 102%. In spite of the complex 2009, net transfers to provisions were just €7m (€258m in 2008). This was a consequence of the decline in lending and a focus on customers of high credit quality.
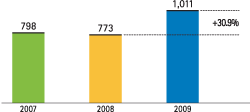
Thanks to the increase in recurrent revenues, cost control and lower loan-loss provisioning, WB&AM’s net attributable profit in 2009 (counting only Europe, New York and Asia) came to €1,011m as at December 31, 2009 (up 30.9% on 2008).
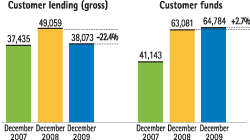
In terms of business activity, the area’s gross lending fell 22.4% year-on-year to €38,073m at December 31, 2009, which is mainly held by Corporate and Investment Banking. Nonetheless customer funds (deposits, mutual funds and pension funds) performed favorably, rising 2.7% to €64,784m thanks to a considerable increase in deposits. The combined effect of the decline in lending and the rise in fund gathering helped to improve the area’s liquidity profile.
The business and income of WB&AM units in Latin America are recorded in their respective areas (Mexico and South America). In addition to the figures mentioned above, WB&AM has contributed the amounts reflected in the table in all of the areas where the Group operates.
Wholesale Banking & Asset Management Efficiency ratio
(Percentage)
Wholesale Banking & Asset Management Operating income
Wholesale Banking & Asset Management
(Million euros)
Wholesale Banking & Asset Management Net attributable profit
(Million euros)
Income Statement
(Million euros)
Download
|
|
|
|
|
Units: |
|
Wholesale Banking & Asset Management |
Corporate and Investment Banking |
Global Markets |
|
2009 |
∆% |
2008 |
2007 |
2009 |
∆% |
2008 |
2009 |
∆% |
2008 |
| Net interest income |
1,148 |
53.9 |
746 |
(13) |
579 |
13.6 |
509 |
625 |
92.0 |
326 |
| Net fees and commissions |
516 |
24.7 |
414 |
442 |
360 |
54.4 |
233 |
45 |
46.1 |
31 |
| Net trading income |
(53) |
n.m. |
140 |
789 |
37 |
(30.6) |
53 |
(150) |
n.m. |
64 |
| Other income/expenses |
317 |
(22.6) |
409 |
377 |
1 |
(30.7) |
1 |
133 |
19.7 |
111 |
| Gross income |
1,928 |
12.8 |
1,709 |
1,596 |
976 |
22.6 |
796 |
654 |
22.9 |
532 |
| Administration costs |
(541) |
8.2 |
(500) |
(451) |
(174) |
1.8 |
(171) |
(227) |
3.9 |
(219) |
| Personnel expenses |
(353) |
12.5 |
(314) |
(282) |
(105) |
(0.8) |
(106) |
(128) |
4.2 |
(123) |
| General and administrative expenses |
(178) |
0.2 |
(178) |
(162) |
(67) |
5.7 |
(63) |
(97) |
3.1 |
(94) |
| Depreciation and amortization |
(10) |
18.0 |
(9) |
(7) |
(2) |
20.2 |
(1) |
(2) |
18.2 |
(2) |
| Operating income |
1,386 |
14.7 |
1,209 |
1,144 |
802 |
28.3 |
625 |
427 |
36.3 |
313 |
| Impairment on financial assets (net) |
(7) |
(97.3) |
(258) |
(131) |
(16) |
(86.7) |
(124) |
3 |
n.m. |
(140) |
| Provisions (net) and other gains (losses) |
(5) |
n.m. |
5 |
4 |
(3) |
175.4 |
(1) |
0 |
n.m. |
(1) |
| Income before tax |
1,375 |
43.8 |
956 |
1,017 |
783 |
56.6 |
500 |
430 |
148.7 |
173 |
| Income tax |
(360) |
103.0 |
(177) |
(208) |
(230) |
56.7 |
(147) |
(110) |
183.9 |
(39) |
| Net income |
1,015 |
30.3 |
779 |
809 |
553 |
56.5 |
353 |
320 |
138.5 |
134 |
| Minority interests |
(3) |
(44.9) |
(6) |
(10) |
- |
- |
- |
(2) |
(60.4) |
(5) |
| Net attributable profit |
1,011 |
30.9 |
773 |
798 |
553 |
56.5 |
353 |
318 |
146.6 |
129 |
Balance sheet
(Million euros)
Download
|
31-12-09 |
∆% |
31-12-08 |
31-12-07 |
31-12-09 |
∆% |
31-12-08 |
31-12-09 |
∆% |
31-12-08 |
| Cash and balances with central banks |
624 |
(59.4) |
1,539 |
1,142 |
68 |
4.5 |
65 |
549 |
(62.6) |
1,469 |
| Financial assets |
61,216 |
(4.8) |
64,318 |
45,370 |
420 |
0.3 |
419 |
58,631 |
(3.0) |
60,424 |
| Loans and receivables |
51,028 |
(24.6) |
67,701 |
45,447 |
37,883 |
(23.2) |
49,297 |
11,857 |
(26.1) |
16,048 |
| – Loans and advances to customers |
37,493 |
(21.8) |
47,950 |
36,495 |
36,130 |
(21.2) |
45,861 |
1,224 |
(40.2) |
2,048 |
| – Loans and advances to credit institutions and other |
13,536 |
(31.5) |
19,751 |
8,952 |
1,753 |
(49.0) |
3,436 |
10,633 |
(24.1) |
14,001 |
| Inter-area positions |
24,454 |
n.m. |
1,593 |
7,819 |
6,038 |
n.m. |
- |
20,337 |
28.3 |
15,851 |
| Tangible assets |
37 |
(13.8) |
43 |
40 |
1 |
14.4 |
1 |
4 |
(7.2) |
5 |
| Other assets |
2,272 |
42.7 |
1,592 |
1,153 |
29 |
12.6 |
26 |
1,169 |
(0.9) |
1,179 |
| Total assets/liabilities and equity |
139,632 |
2.1 |
136,785 |
100,971 |
44,439 |
(10.8) |
49,808 |
92,547 |
(2.6) |
94,976 |
| Deposits from central banks and credit institutions |
34,935 |
34.5 |
25,972 |
35,353 |
1,136 |
46.9 |
773 |
33,589 |
33.6 |
25,140 |
| Deposits from customers |
63,330 |
4.1 |
60,847 |
40,760 |
38,668 |
14.9 |
33,664 |
24,661 |
(9.0) |
27,093 |
| Debt certificates |
(130) |
(31.1) |
(189) |
(8) |
- |
(100.0) |
1 |
(130) |
(31.5) |
(190) |
| Subordinated liabilities |
2,222 |
(9.8) |
2,463 |
1,747 |
1,083 |
(1.8) |
1,103 |
482 |
(8.1) |
525 |
| Inter-area positions |
- |
- |
- |
- |
- |
(100.0) |
11,136 |
- |
- |
- |
| Financial liabilities held for trading |
30,938 |
(20.1) |
38,701 |
16,963 |
0 |
(96.5) |
5 |
30,937 |
(20.0) |
38,695 |
| Other liabilities |
4,398 |
(4.9) |
4,626 |
3,405 |
1,627 |
39.4 |
1,166 |
2,156 |
(22.7) |
2,791 |
| Economic capital allocated |
3,939 |
(9.8) |
4,365 |
2,750 |
1,925 |
(1.8) |
1,959 |
851 |
(7.6) |
921 |
Relevant business indicators
(Million euros and percentages)
Download
|
Wholesale Banking & Asset Management |
|
31-12-09 |
∆% |
31-12-08 |
31-12-07 |
| Total lending to customers (gross) |
38,073 |
(22.4) |
49,059 |
37,435 |
| Customer deposits¹ |
61,213 |
(1.4) |
62,094 |
40,562 |
| – Deposits |
53,645 |
2.7 |
52,257 |
31,355 |
| – Assets sold under repurchase agreements |
7,568 |
(23.1) |
9,837 |
9,207 |
| Off-balance sheet funds |
11,139 |
2.9 |
10,824 |
9,788 |
| – Mutual funds |
3,914 |
(2.5) |
4,014 |
2,425 |
| – Pension funds |
7,224 |
6.1 |
6,810 |
7,363 |
| ROE (%) |
25.5 |
|
23.2 |
31.7 |
| Efficiency ratio (%) |
28.1 |
|
29.3 |
28.3 |
| NPA ratio (%) |
1.0 |
|
0.2 |
0.0 |
| Coverage ratio (%) |
102 |
|
n.m. |
n.m. |
¹ Includes collection accounts.
Wholesale Banking & Asset Management
(Million euros)
Wholesale Banking & Asset Management including the Americas
(Million euros)
Download
|
31-12-09 |
D% |
31-12-08 |
31-12-07 |
| Gross income |
3,062 |
18.2 |
2,590 |
2,294 |
| Operating income |
2,327 |
22.4 |
1,902 |
1,646 |
| Income before tax |
2,214 |
39.1 |
1,592 |
1,510 |
| Net attributable profit |
1,486 |
33.6 |
1,112 |
1,097 |
| Customer lending (gross) |
47,700 |
(20.4) |
59,950 |
49,299 |
| Deposits |
64,559 |
4.4 |
61,848 |
40,517 |